


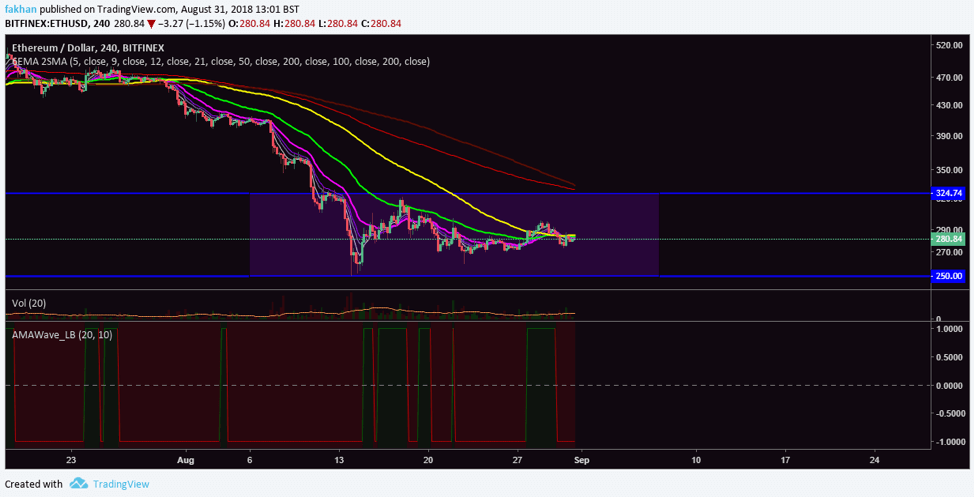
Ethereum (ETH) has been consolidating since the beginning of August. The above 4H chart for ETH/USD shows that this consolidation has now come to an end as the 50 EMA is about to cross above the 100 EMA. This will mark the beginning of a new trend for the month of September. As the chart above shows, the gap between the 100 EMA and the 50 EMA has been decreasing during the latter half of August. AMAWave diagram on the above chart also corroborates our analysis that the price has completed a consolidation and is now ready to take off from these levels to begin a new trend.
Ethereum (ETH) has seen an increase in volume during the period of consolidation shown on the chart. The price is ready to break above the 21, 50 and 100 EMAs all at the same time which means that the rally will be swift and aggressive. The price may later face resistance at the 200 EMA but around September, when the 50 EMA crosses above the 200 EMA, a golden cross will be formed which will set the ground for a new bullish cycle for Ethereum (ETH). The price of Ethereum (ETH) has seen a long streak of red days for now and has already been through more than a 90% correction. The cryptocurrency also seems to have completed its cycle against Bitcoin (BTC) at the same time. A lot of ICOs are ready to kick start their fundraising as soon as the market recovers, which will put a lot of buy pressure on Ethereum (ETH) and the price will rise in anticipation of that, even before the ICO buying of Ethereum (ETH) occurs.
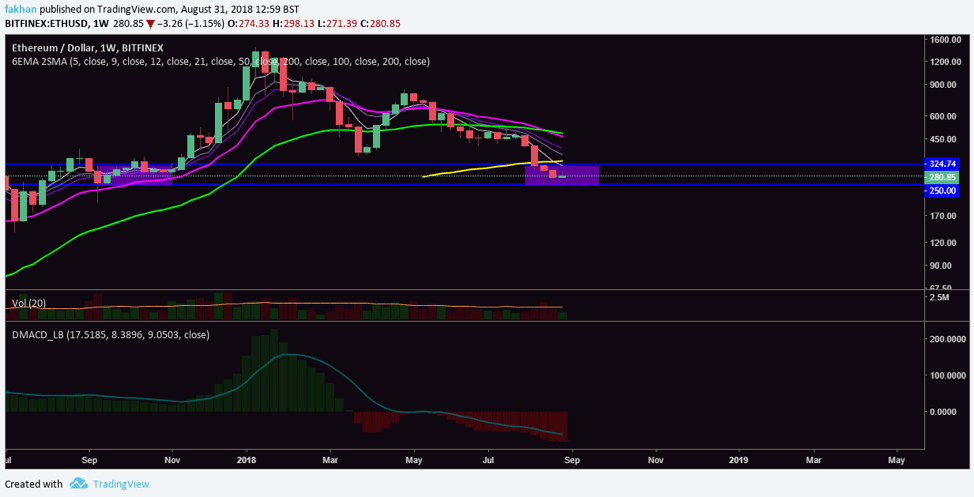
The above weekly chart for ETH/USD shows that the price action for Ethereum (ETH) has been a lot more simple and straightforward compared to most cryptocurrencies. This means that the price has just completed a full cycle and is now preparing to exit a phase of consolidation on the weekly time frame. The support at $250 has served to be a critical one for Ethereum (ETH) which the price has held so far. Ethereum (ETH) has been consolidating in a tight range between $324 and $250 on the weekly timeframe. DMACD profile for the above chart shows that this consolidation is about to come to an end even on the weekly time frame and Ethereum (ETH) is all set to begin a new cycle in the weeks ahead.
The price of Ethereum (ETH) is likely to form a doji on the weekly time frame if it closes around the same levels. A doji at this level will be seen as a bullish indicator that might also serve as green light for a new cycle. Earlier this month, the 21 EMA broke below the 50 EMA which resulted in a long streak of red weeks as the price plunged. This time though, the 21 EMA is already below the 50 EMA and is all set to break above it in the next few weeks to begin a bullish wave.


