


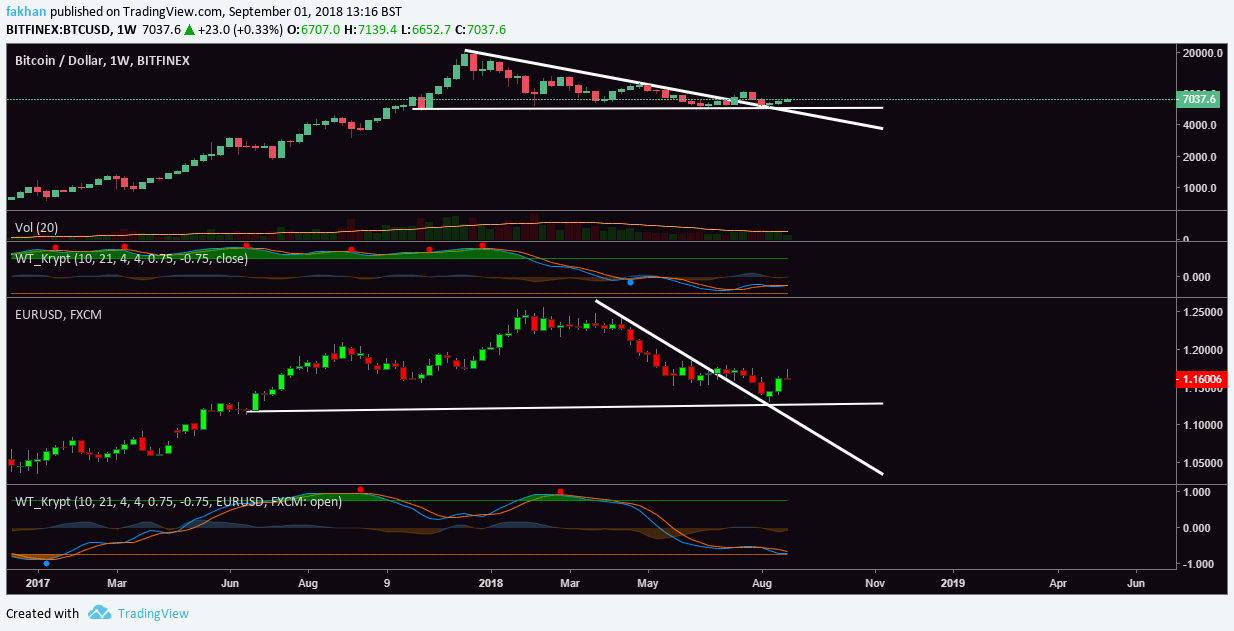
Bitcoin (BTC) and the Euro (EUR/USD) have been trading not just in the same direction, but in a similar manner. The above weekly charts for BTC/USD and EUR/USD show that the both topped out around January 2018 and since then have been in a correction. Bitcoin (BTC) broke the downtrend against US Dollar which later became a support as Bitcoin (BTC) bounced off it in August. The same happened with EUR/USD as the Euro broke the downtrend against US Dollar which later became a support. The three green candles visible on the EUR/USD weekly chart show that the Euro has broken its downtrend against the US Dollar and is now at the verge of a trend reversal same as Bitcoin (BTC). Interestingly enough, wave trend analyses for both Bitcoin (BTC) and the Euro (EUR/USD) have similar implications.
Wave trend profile for Bitcoin (BTC) shows that the blue line is almost on top of the orange line and is likely to break above it as early as next week. Similar wave trend profile for the Euro (EUR/USD) shows the blue line ready to take on the orange line and for the first time since the Euro (EUR/USD) broke its downtrend against the US Dollar (USD). This confirms the correlation between the price action of Bitcoin (BTC) and the Euro (EUR/USD), both of which have been moving in the same direction but not at the same pace. Our findings show that the price of Bitcoin (BTC) has traded a lot more aggressively compared to the price of the Euro (EUR/USD) as if trading Bitcoin (BTC) was liking trading the Euro (EUR/USD) on margin.
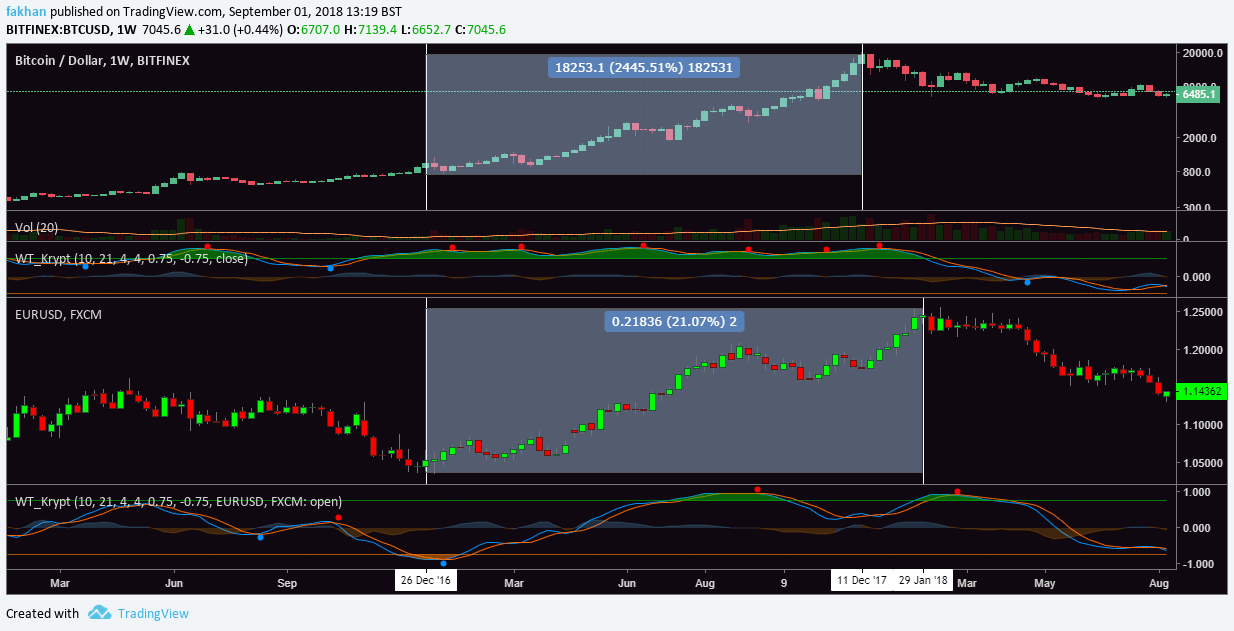
The above weekly charts for both BTC/USD and EUR/USD show that during December 2016, both Bitcoin (BTC) and the Euro (EUR/USD) followed a very similar rally to new highs. Both the charts show very similar fractals. However, the difference is in the gains. The price of Bitcoin (BTC) appreciated 2445% against the US Dollar (USD) during this rally whereas the price of Euro (EUR/USD) appreciated only 21% against the US Dollar (USD) during the same time. As the above charts show, Bitcoin (BTC) began its rally just when the Euro (EUR/USD) reached its bottom and later reached its top before the Euro (EUR/USD) had peaked, which further corroborates our view that Bitcoin (BTC) has been trading in a reaction to the Euro (EUR/USD), but only with more intensity.
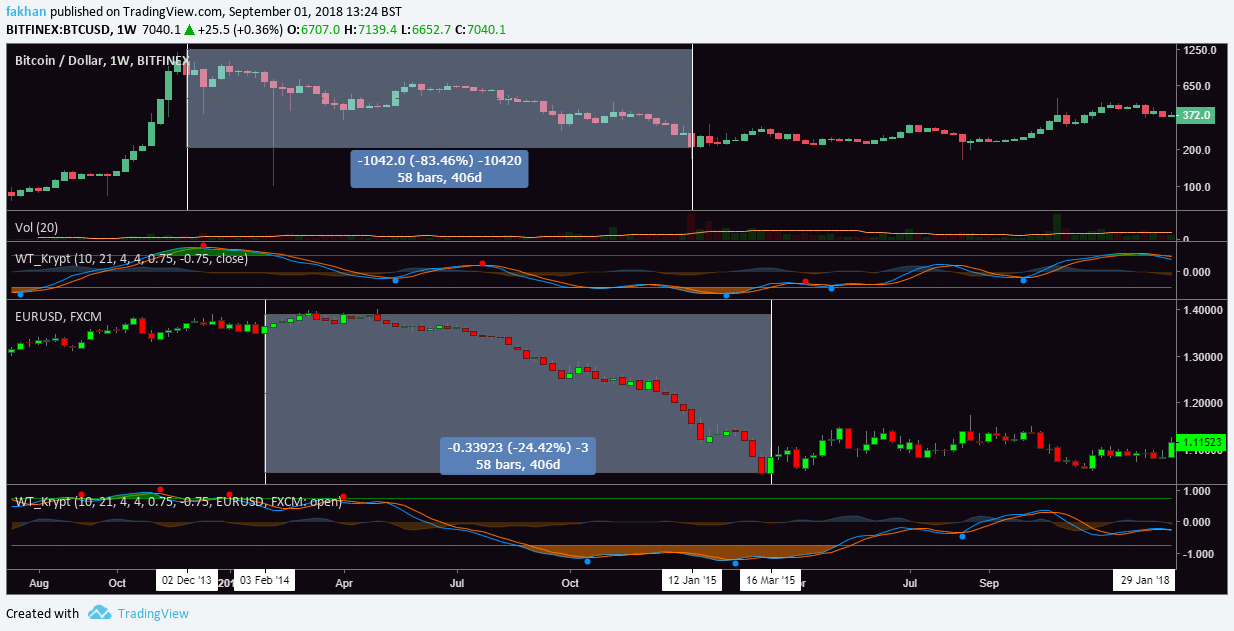
The same behavior was exhibited during the 2014 correction as the above weekly charts for BTC/USD and EUR/USD show. The chart shows similar fractals for both BTC/USD and EUR/USD during the same time but where they differ is in the intensity of the correction. Bitcoin (BTC) had a correction of −83.4% during a period of 406 days whereas the Euro (EUR/USD) had a correction of only −24.4% during the same period of 4016 days. This goes on to show that while Bitcoin (BTC) has been reacting to the movements of the Euro (EUR/USD) this entire time, it has done so with more intensity as if one was trading the Euro (EUR/USD) on margin.


