


Bitcoin on Tuesday continued its uptrend, rising close to 3 percent since its intraday low from yesterday.
The BTC/USD pair today opened near 7272-fiat while correcting from its previous low around 7248-fiat. At the beginning of the Asian trading session, the pair stayed on a stable and steady uptrend. As the session matured, and European hours came into play, the uptrend intensified and eventually formed higher highs towards 7415-fiat. At the same time, BTC/USD continued to flirt with the Rising Wedge resistance level.
BTC/USD Technical Analysis
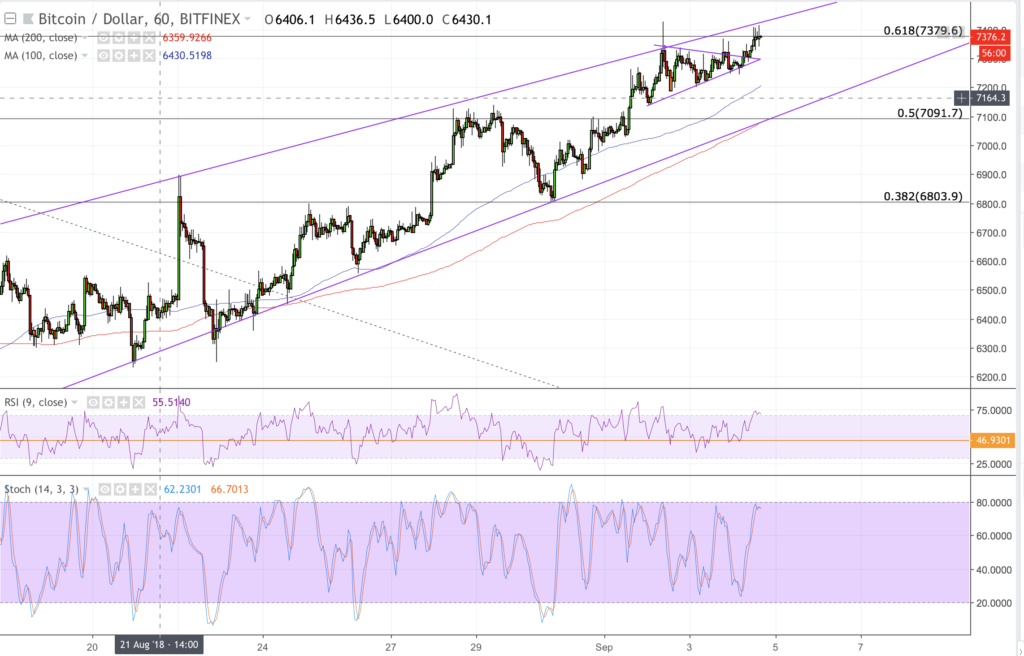
While BTC/USD continues to trend upward inside the Rising Wedge channel, introduced in one of our previous analysis, we are also noticing a bull pennant formation to confirm a stable bullish sentiment in the market. The BTC/USD on hourly charts is also above its 100H and 200H moving averages, while the RSI and Stochastic Oscillator indicators have also jumped close to the overbought regions, further strengthening in the near-term bullish bias of the Bitcoin market.
We are of course waiting for a potential breakout above the Rising Wedge resistance to confirm a strong medium-term rally towards the next upside targets, primarily towards 7460-fiat while eyeing 7819-fiat. Let’s discuss our intraday positions further in the section below.
BTC/USD Intraday Analysis
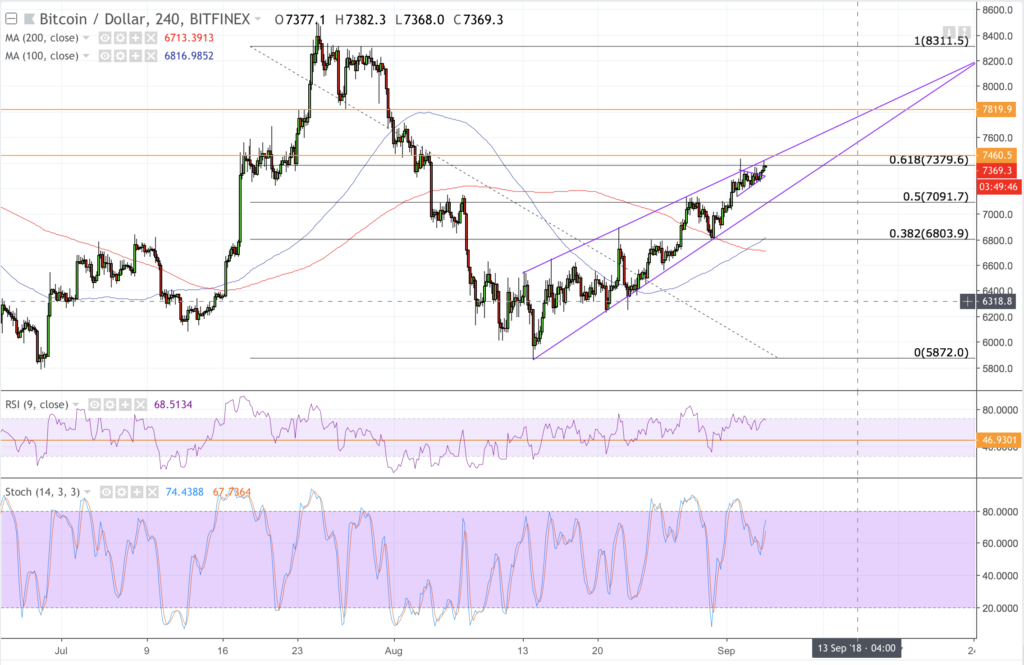
We have already undergone a crossover in the 4H chart which technically means a potential upside breakout in the medium-term. So naturally, we are more focused on long position today while keeping our stop losses in place to safeguard our positions from any potential bias reversal.
That being said, the range we are watching for today is defined by 7379-fiat as our interim resistance and 7153-fiat as our interim support. We are first waiting to put a long position towards 7460-fiat should BTC/USD invalidates interim resistance to the upside. In this position, a stop loss four-pips below the entry point would protect us from any bias reversals.
Looking the other way, a drop below 7153-fiat could mean a smooth run towards the next downside target near the 38.2% Fibonacci retracement level at 7091-fiat. From that level or before, we could also expect a bounce-back scenario that could open decent look opportunities towards the interim resistance level at 7379-fiat.
However, if BTC/USD breaks even below the 7091-level, such that the Rising Wedge support is also invalidated, the next downside target in sight could be towards 6800-fiat.
Featured image from Shutterstock. Charts from TradingView.
=
Follow us on Telegram or subscribe to our newsletter here.
• Join CCN’s crypto community for $9.99 per month, click here.
• Want exclusive analysis and crypto insights from Hacked.com? Click here.
• Open Positions at CCN: Full Time and Part Time Journalists Wanted.
