


Silver miners lost 25% between May and August. Against one year ago they lost 33%. Is the recent drop accelerating or ending? Will the recent silver miners crash of 2018 continue or end? We look at the SIL ETF chart, representing silver miners, as well as silver COT data, to answer this question.
We’ll first start with a review of the silver price crash of 2018, and then review the silver miners crash of 2018. We will put both in perspective.
The silver crash of 2018 in perspective
First, let’s go back to our Silver Price Forecast for 2018 which we wrote almost a year ago. In it we concluded with this: “Moreover, $14 is a major price level as it marks the lows of the last 9 years. If silver sets a major double bottom between 14 and 15 in 2018 then (only then) will we become very bullish for the long term.”
Moreover, in our Silver Price Crash of 2018 piece written on the day silver crashed to its lowest point of the last 30 months, on August 14th of 2018, we noted the following: “There is so much support on the monthly silver price chart in the $13 to $14 area that we forecast the silver price crash 2018 to end sooner rather than later.”
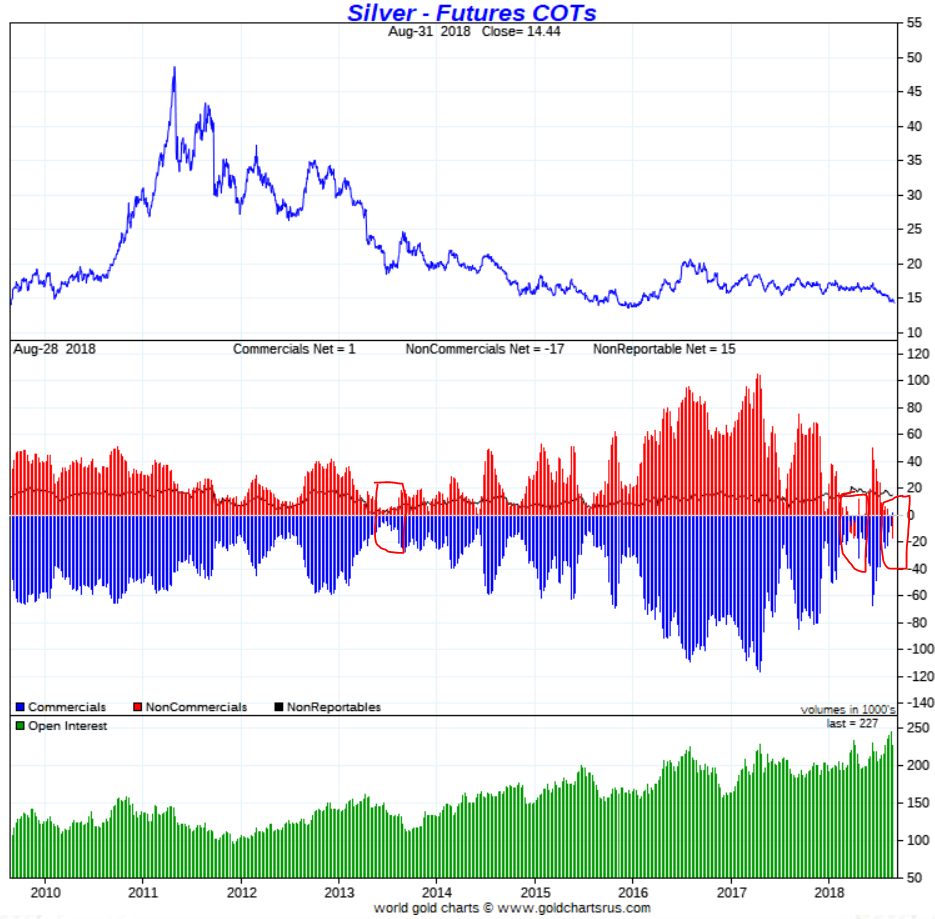
While the silver chart looks quite ugly today, with a loss of more than 2 pct, again, we also reckon it has reached extreme levels. Not necessarily and only on its chart, but, more so, in the silver futures market. The Commitment of Traders report (COT) has the most extreme (bearish) levels in its history!
How to read this chart? The extreme levels in center pane are the ones to focus on. The closer positions to the zero line, the deeper the bottom that will be set. This may vary if the silver market is in a bull market vs a bear market, but the point is that extreme positions cannot last for a long time. Note how each previous instance of similar readings got followed by a powerful short to medium term rally, see red circles on the chart.
The silver miners crash of 2018 in perspective
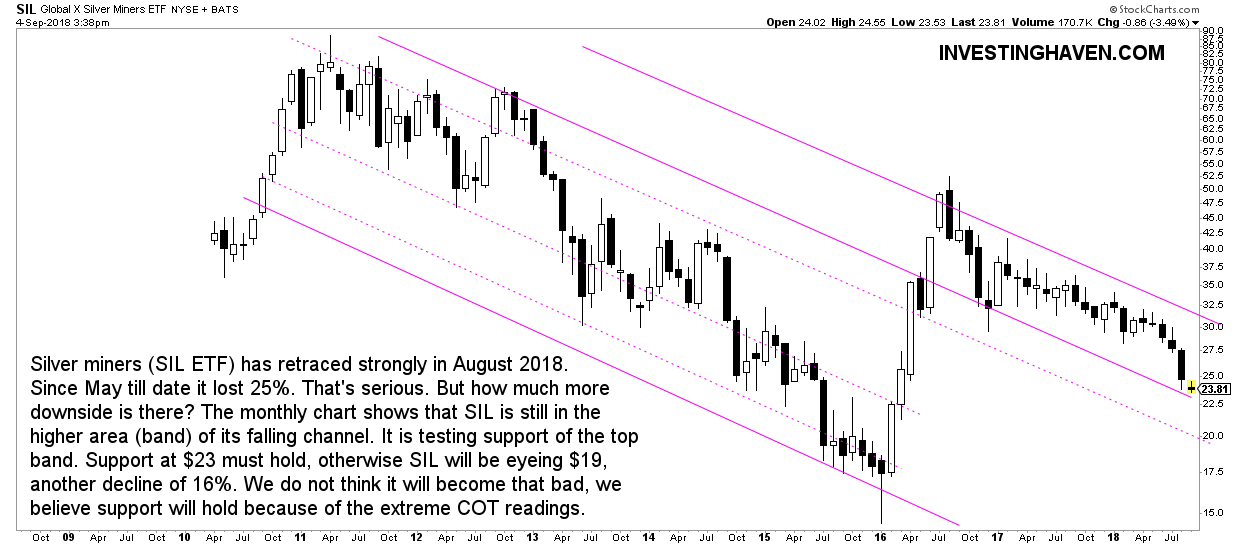
Silver miners, no coincidence, are losing serious value today. The silver miners crash of 2018 is visible on the SIL ETF chart.
The chart below is the monthly SIL ETF since 2010 when the price of silver peaked.
We see a clear pattern on this chart. The falling structure is a clear and concise channel, and it has several ‘bands’. It is a perfect way to split this chart in different areas, it almost becomes a heat-map.
The silver miners crash of 2018 still resides in the upper band of the falling channel. This means that, so far, it is the least bearish area in the 7 year silver miners bear market.
That’s the way to put the silver miners crash in perspective.
Now this does not necessarily imply that the drop will stop right here right now. With the ultra-bearish and super-extreme COT readings we expect the silver market to recover any time soon. So as these silver COT readings are at extremes, and it coincides with the silver miners chart falling to support in the area it resides in for the last 24 months, we believe current support in SIL ETF will hold.
If, and that’s a big IF, current support gives way we may see another 16% drop in silver miners where SIL ETF will fall to $19.
The conclusion which we wrote in our silver price crash piece last month also applies to the ongoing silver miners crash: “This is not a time to short the silver market, this is a time to monitor it closely, and determine a good entry point, ideally as the precious metals market calms down. There is no sense in trying to ‘catch a falling knife’, it is wise practice to give things some time and get a confirmation of a bottom.”
Crypto market BREAKOUT: InvestingHaven flashed a BUY alert on July 18th 2018. Top notch guidance on how to play this breakout, tips on establishing a future proof crypto portfolio, our selection of 10 top cryptocurrencies and blockchain stocks. Go to our Blockchain Investing Service >>
