


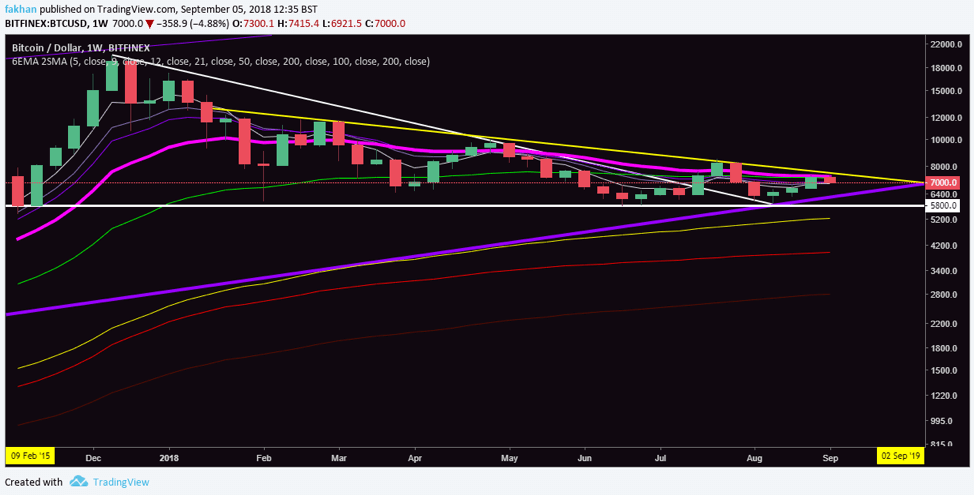
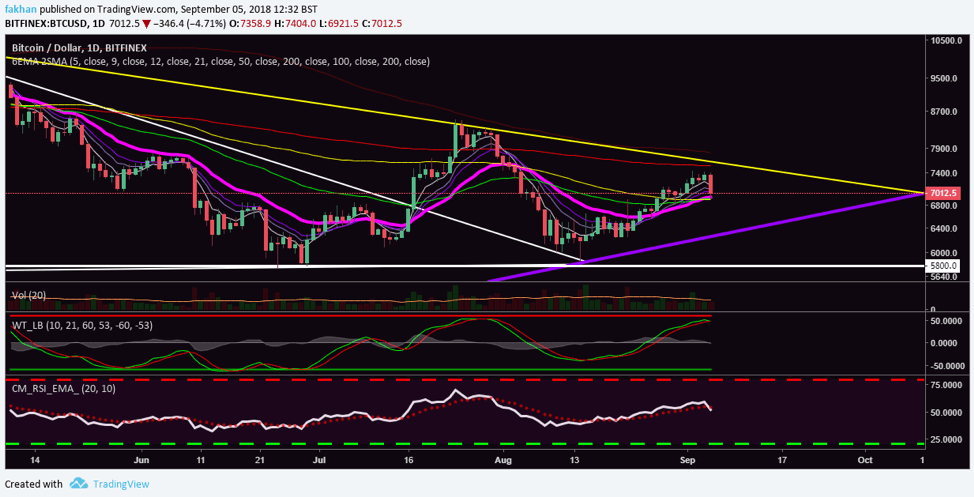
Bitcoin (BTC) is an interesting point. The price has just found a strong resistance at the 21 Week EMA shown on the BTC/USD weekly chart above, but it has also found a strong support at the 21 Day EMA. What does this mean for Bitcoin (BTC)? If both of these 21 EMA resistance and support hold strong for the weeks ahead, this means that Bitcoin (BTC) will enter a phase of consolidation before its next move. If that were to happen at this stage, it will be a very bullish development for Bitcoin (BTC) as the price will consolidate all the way till it reaches the historical trend line, thereby completing the correction from every angle. This would be a big confidence booster for investors who are sitting on the sidelines waiting for the market to throw them some solid signs before they get in the game again.
Even if Bitcoin (BTC) does not move sideways for the next few weeks and the price falls all the way down to the trend line or to the $5,800 support and bounces back up, it will serve as a similar confidence booster for the bulls and the bearish sentiment will weaken significantly. Currently, the bearish sentiment is one of the strongest it has ever been as the number of shorts on exchanges like Bitmex and Bitfinex is on a constant rise. To contrarians, this would be a sign of a trend reversal as the market has become overly bearish. However, given that the volume is so low that just a couple of million dollars can move the price significantly, there does remain a possibility that the market can overreact.
So, going long or short on any exchange or trading on margin is certainly not advisable at this point as the market is directionless at the moment. Most investors who have been around for long know that the market has completed similar cycles in the past where everything looks as if it is the end of blockchain or cryptocurrencies but then all of a sudden it is not, and we see big green spikes appearing and everyone is completely surprised as to what is happening but boards the train anyway. Markets always follow cycles and every bearish cycle is followed by a bullish one. However, it would not be wise to presume that you know for sure when a cycle has ended or where the next one has begun.
Most indicators do give us an idea as to what is going on and based on those, we can prepare ourselves for possibilities. The above chart for BTC/USD on the daily time frame shows that the price of Bitcoin (BTC) has found a strong support at the 21 daily EMA and will not fall below it without putting up a fight. Wave trend analysis and RSI analysis point to a different scenario though as they show weakness and the likelihood that the price might fall to lower levels first before beginning a new cycle.
