


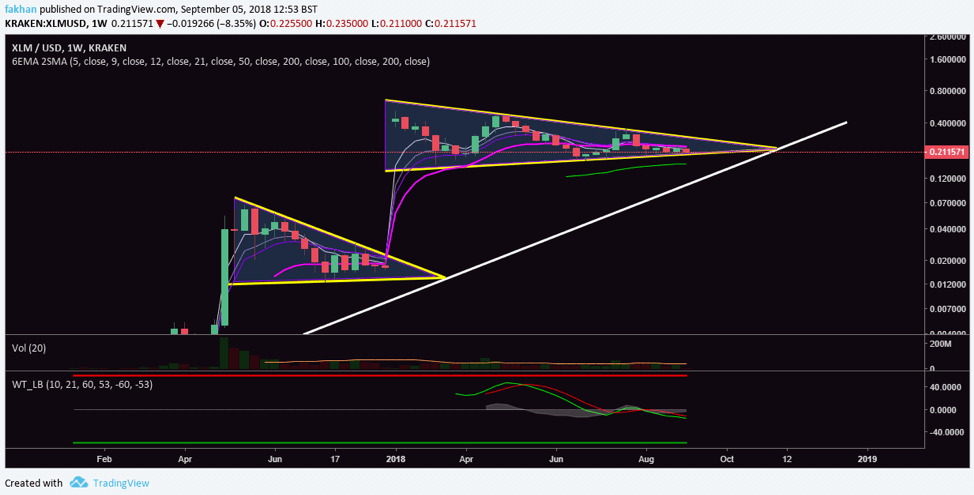
Stellar (XLM) seems to be at a stage where it is just waiting for the rest of the market to recover. The weekly chart above for XLM/USD shows that the price has already closed four candles below the 21 Week EMA and could now close the fifth candle below the 21 EMA as well. This means that Stellar (XLM) has had its correction and the price is now range bound, waiting for the rest of the market to recover. Stellar (XLM) has a history of consolidating candles on the weekly time frame before a break out occurs. This break out is very abrupt and aggressive in nature as we have seen in the past.
Wave trend analysis for the above chart shows that the price of Stellar (XLM) has moved all it could against the US Dollar (USD) and is now unlikely to fall further. In fact, it is waiting for a market recovery to initiate a trend reversal. Volume for Stellar (XLM) has also been on a constant decline but buy walls on major exchanges are highly unlikely to allow the price to slide below $0.20. Before the previous breakout in 2017, Stellar (XLM) completed a total of seven consolidation candles before a break out. This time, the price has completed just four but could complete more in the weeks ahead if the market fails to recover.
Stellar (XLM) has seen a lot of interest during the past few months which has made it difficult for its price to slip below the $0.21 mark. Businesses as well as ICOs have shown interest not just in Stellar (XLM)’s use as a cryptocurrency but also in the Stellar blockchain. IBM seems to have done a good job at putting Stellar (XLM) in front of large corporations but it is just getting started and investors know it. Stellar (XLM) reached a price of just over $1 during its previous bull run. If the market continues the same trajectory and Stellar (XLM) continues to have a strong use case, the project is likely to cross the $2 mark during its next bullish cycle.
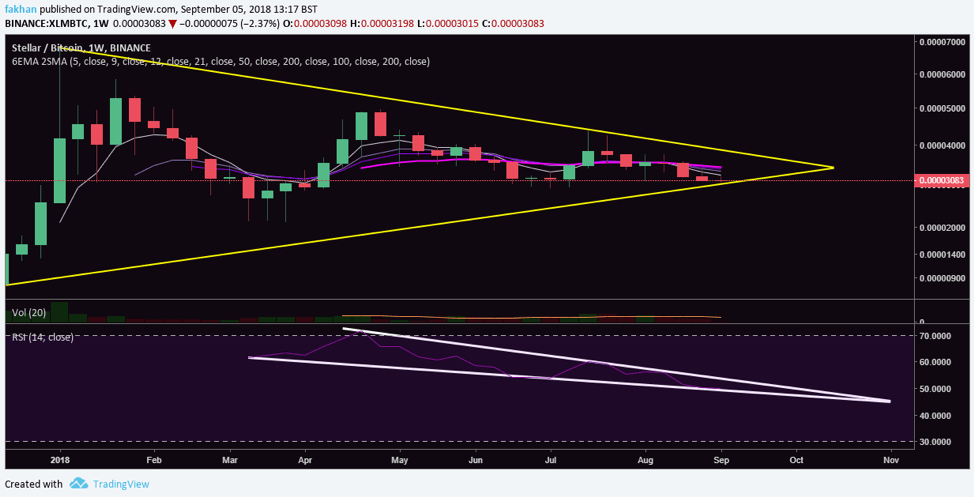
Stellar (XLM) has also reached the full extent of its correction against Bitcoin (BTC) and is now at a point of a trend reversal. The above weekly chart for XLM/BTC shows how Stellar (XLM) has now reached the limit of its movement in a triangle against Bitcoin (BTC). XLM/BTC has also retested the trend line again and respected it. The EMA alignment continues to remain bearish for now but it has become a lot easier for the price to break EMA resistances as the price has traded further along the triangle.
RSI conditions for XLM/BTC show that there may still be room for the price to trade sideways till the end of September but the month of October is most likely to be a bullish one as Stellar (XLM) is expected to begin its new cycle by then, if not before.
