


As soon as Bitcoin (BTC) fell below $7,000, retail bears became loud once again. Calls for a fall to $4,000 or lower have become popular once again in the crypto community. The popular sentiment at the moment is bearish. If an analysis points to the possibility of a fall below $4,000, it is more readily accepted than the one that calls for a rise above $8,000. As we have seen in the past, in this market as well as other markets, when too many people start thinking the same way, it is time to prepare for a trend reversal. The question this time is whether positive sentiment in the market is completely obliterated or not.
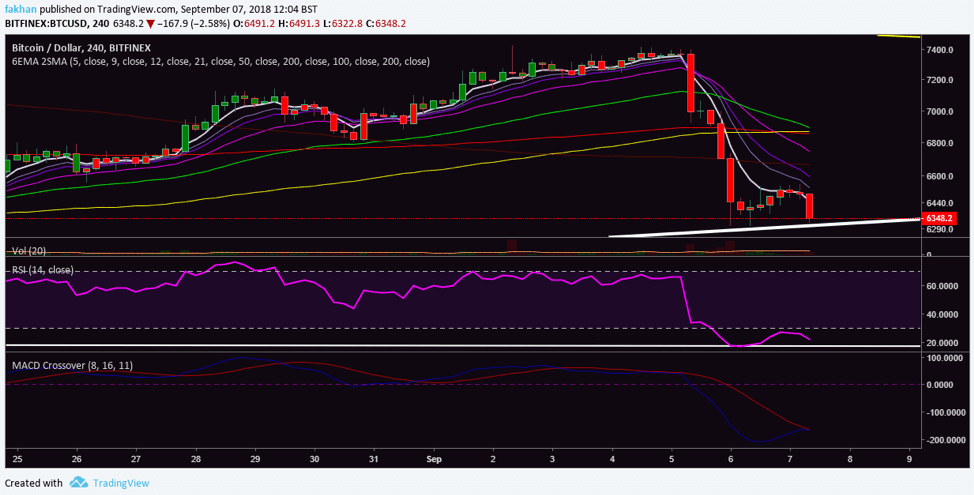
The above 4H chart for BTC/USD shows us that at this point, the market makers just dump their Bitcoin (BTC) without any FUD or negative news because there is none left! Previously, most of these dumps would be masked under negative events but there are no negative events left except for the one on September 30 when the SEC will likely reject all Bitcoin ETF Proposals. So, what is really going on? The fear in the market seems to be real and even seasoned investors are confused whether the market can still fall further. However, it is very important to note that this fear has not stopped them from buying because they know that the risk/reward is well worth it.
Bitcoin (BTC) formed a big red candle on the 4H chart today when the price failed to hold above the 5 EMA and broke through it to settle back at the trend line. RSI on the 4H chart looks to be consolidating as it prepares for a rally from current levels. MACD Crossover on the above chart shows how a rally is in the offing. In all fairness, Bitcoin (BTC) is extremely unlikely to break the trend line and fall below $6,000 at this time. However, given the low volume of Bitcoin (BTC) right now, anything is possible and the possibility of a fall cannot be ruled out. It is important to note though that even if Bitcoin (BTC) does fall, it will climb back up as quickly because the low volume works on both directions.
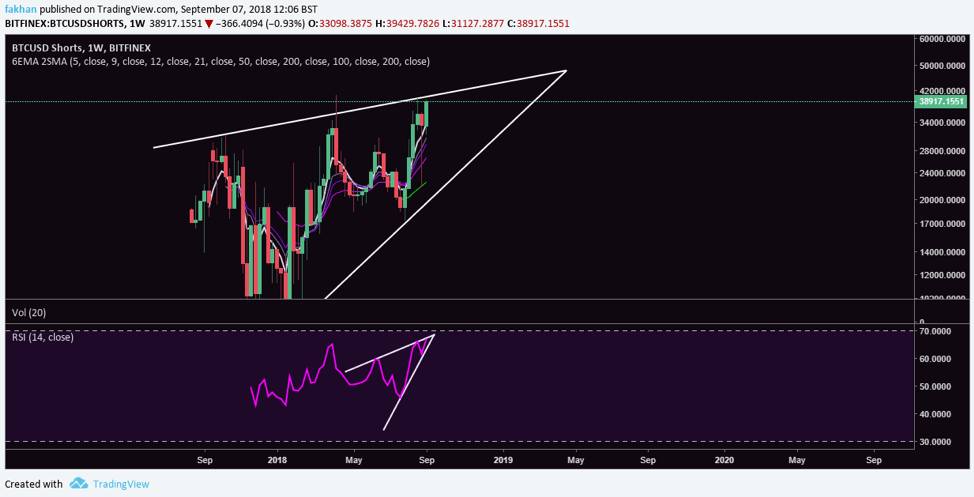
Short term trends might be easy to manipulate in times of low volume, but long terms trends stay intact barring extenuating circumstances. The above weekly chart for BTCUSDShorts shows how the number of shorts has been on a constant rise since the beginning of the correction and is currently at an all time high. BTCUSDShorts has been trading in a rising wedge since the very beginning. The above chart shows that the number of shorts will now have to drop to the lower limit of the rising wedge. If this wedge is broken, it will completely obliterate any bearish bias and the market will skyrocket.
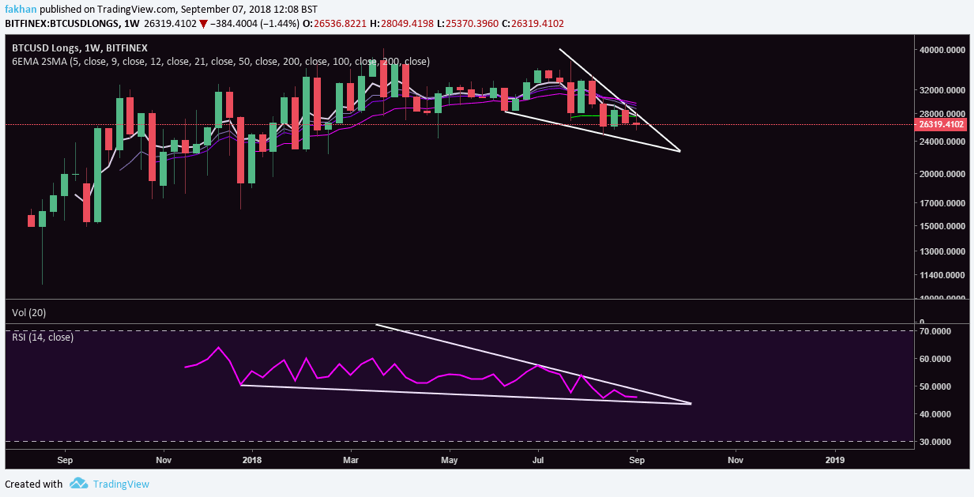
A similar analysis of BTCUSDLongs shows that the number of longs have been on a steady decline since the beginning of the year and have now reached a critical point inside a falling wedge. RSI for the above chart also shows that the number of longs is expected to increase rapidly soon as the RSI breaks out of the falling wedge. As indicated by all these charts, the time frame for a break out for Bitcoin (BTC) is expected to be late September to mid October. All the technical as well as fundamental indicators point to a trend reversal by then. If Bitcoin (BTC) were to drop below $6,000 it may not be able to recover by then to begin a new trend. If it does not begin a trend by then, it will have to invalidate its entire trading history which is possible, but not likely. That is why it is more likely for Bitcoin (BTC) to begin a new trend than to fall below $6,000 from here onwards.
