


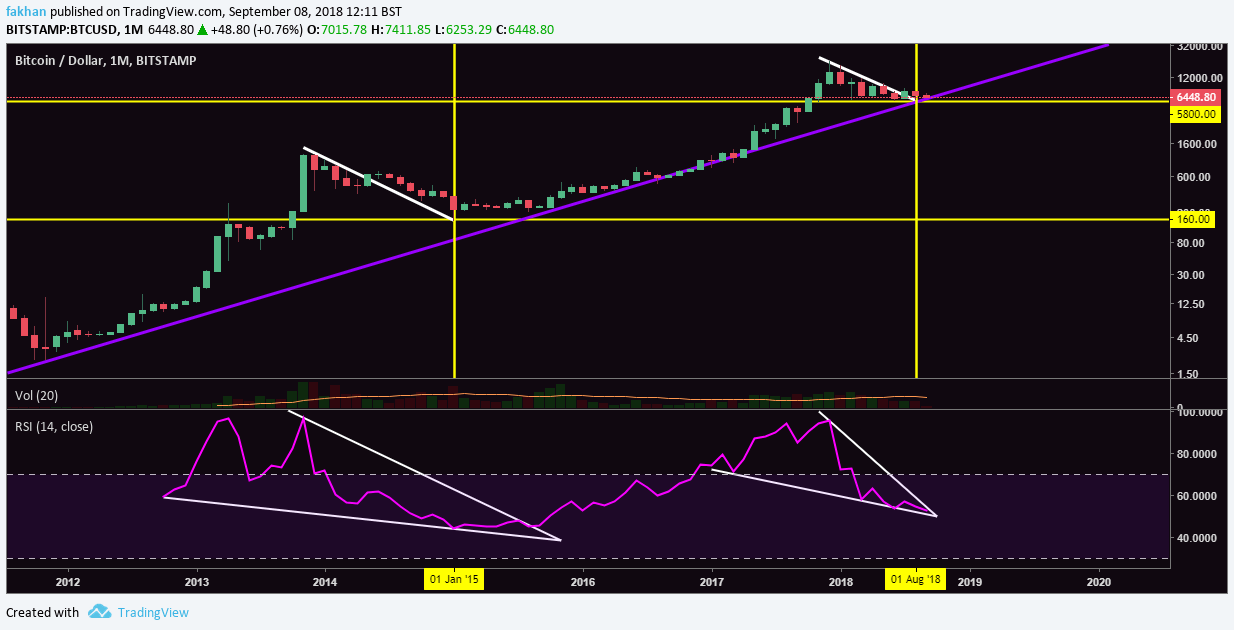
Chart for BTC/USD (1M)
Bitcoin (BTC) appears to have just completed its correction. Meanwhile, the ratio of Commodity Research Bureau Total Return Index (CRB) to that of S&P 500 sits at 0.2. This ratio is currently at a 50 year low which means that stocks have been on a massive bull run against commodities like Gold, Silver, and Platinum for the past 50 years! This trend had to reverse at some time and what better time than a time of uncertainty when fears of the next global financial crisis are already looming over. This time around, we have a new commodity, Bitcoin (BTC) which is expected to have important implications on the events during the next financial crisis.
During previous financial crises, we saw the markets perform badly as people liquidated their assets for cash. The US Dollar used to be the major reserve currency until now so, people across the globe looking to liquidate their stocks, bonds or other assets would get the cash in US Dollar (USD). This raised demand for the Dollar and as we witnessed during the last financial crisis, the US Dollar (USD) climbed strongly against the Euro (EUR). However, this time around, things are very different on multiple fronts. First of all, we have Bitcoin (BTC) now. People used to turn to the US Dollar (USD) during a financial crisis because they had no alternative. This time they have an alternative which if they do not use, they risk getting into a bigger problem.
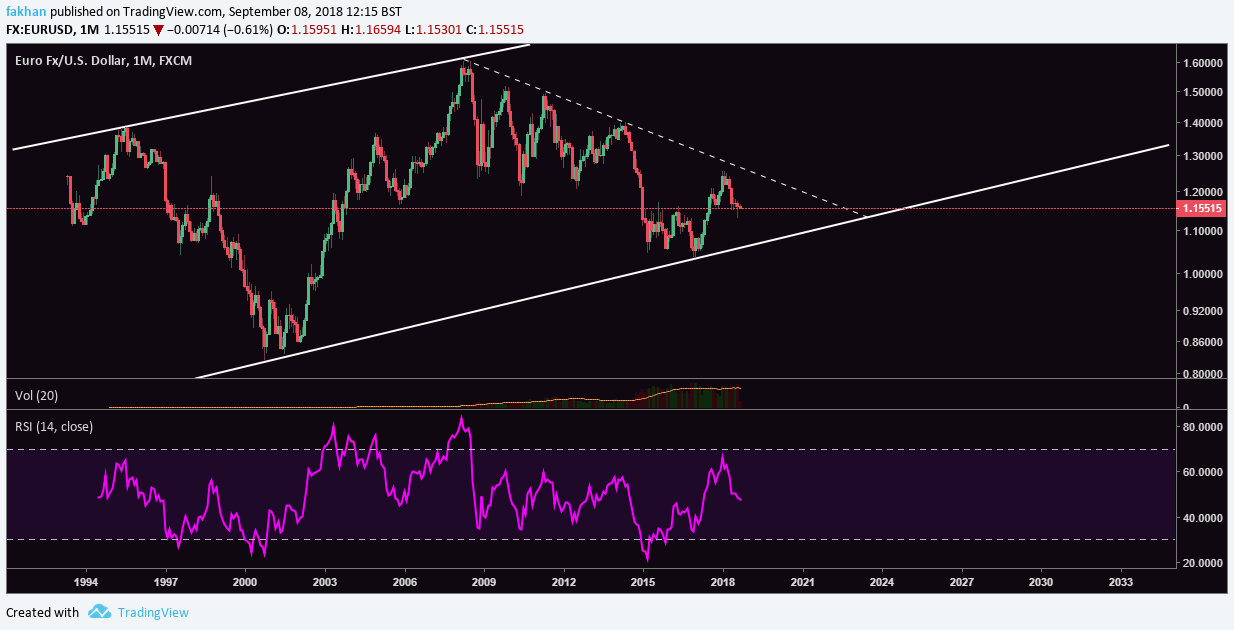
Chart for EUR/USD (1M)
Now, what is that bigger problem? Collapse of the US Dollar (USD). The montly chart above for EUR/USD shows that the pair has been in an ascending channel since 1994. Just before the previous financial crisis, the price for EUR/USD had already reached the top of this channel. This means that the Euro (EUR) was already expected to correct against the Dollar (USD). The financial crisis just accelerated that correction. Since 2009, EUR/USD has been in a constant correction against the US Dollar (USD), till it reached the bottom of the channel in 2017. Now, this was a game changing development, because from here EUR/USD began a new climb towards the top of the channel. We have seen some weakness in EUR/USD for now, but that is temporary. The macro play here though is that if EUR/USD succeeds in breaking the downtrend resistance shown on the above chart with dotted line, it will not only set the stage for collapse of the US Dollar but will bring on a currency crisis.

Chart for BTCUSDShorts (1W)
This time, most of these crises will align together and the global economy will remain in a mess for a long time to face problems in addition to the patch up jobs from before. This will increase demand for commodities like Gold, Silver and Bitcoin (BTC). If the EUR/USD chart from above tells us anything about Bitcoin (BTC), it is that the correction of 2018 was just a minor pullback in the grand scheme of things. The above chart for BTCUSDShorts already shows that the number of shorts is expected to fall drastically soon as the RSI falls out of the falling wedge. When that happens, the bulls will take control and Bitcoin (BTC) will begin a new climb. This is expected to happen by mid September or late October at the latest.
