


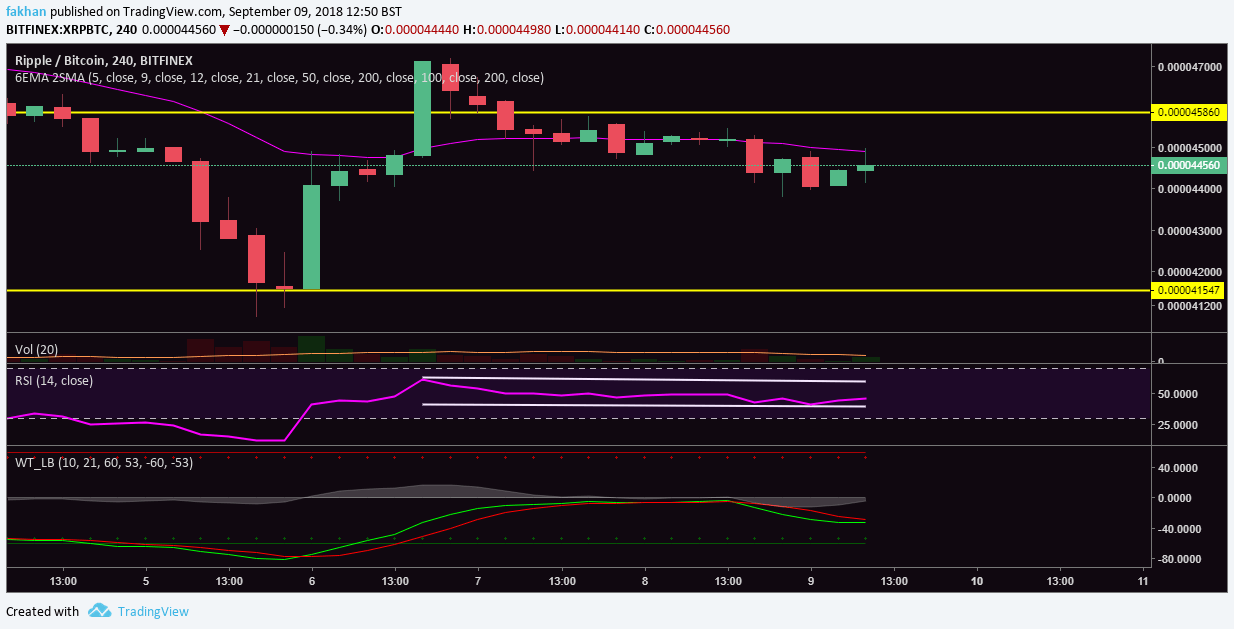
Ripple (XRP) is currently trading within a tight range against Bitcoin (BTC). The price broke the resistance at 45,860 satoshis earlier this month but soon afterwards, it retraced. Initially, the 45,860 satoshis resistance turned into support as the 4H chart above for XRP/BTC shows that Ripple (XRP) formed two red candles after the resistance break. However, both of these candles managed to remain above the resistance turned support line. However, the third candle broke below the 45,860 satoshis resistance turned support and entered a range bound zone once again.
XRP/BTC initially traded along the 21 EMA on the 4H chart. It continued to trade sideways till yesterday when the price finally broke significantly below the 21 EMA and closed below it. This has led to four more candles formed under the 21 EMA on the 4H chart for XRP/BTC. The last candle formed on the above chart has also struggled but failed to break past the 21 EMA. However, in an attempt to do that, it has formed a doji, which can be seen as a bullish sign that might finally push the price of Ripple (XRP) above the 21 EMA.
Breaking the 21 EMA is critical for Ripple (XRP) to break out against Bitcoin (BTC) and exit the range bound territory. However, if the price remains below the 21 EMA for the next week, it is likely to come down to 41,547 satoshis level where it is expected to find a strong support and might also complete its correction against Bitcoin (BTC) for the time being. RSI for the above XRP/BTC chart shows that the price is expected to remain range bound at least till the beginning of next week. Wave trend analysis for the above chart however indicates the possibility of a breakout at the beginning of a next week which might push the price above the 21 EMA.
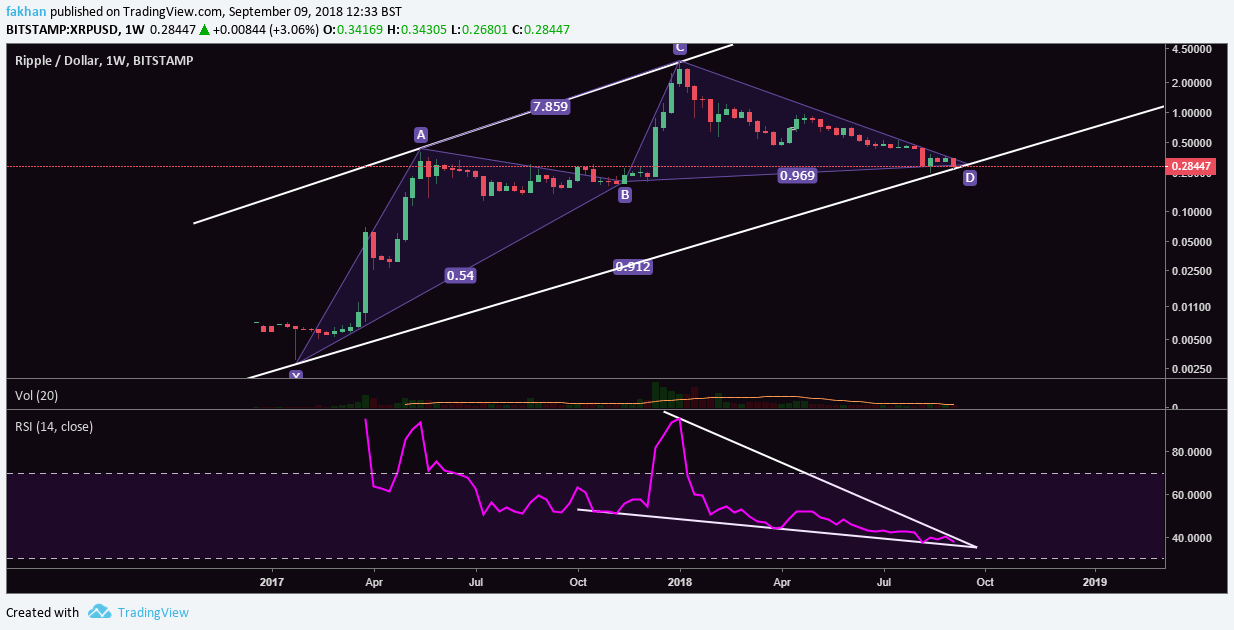
Many investors are focused on shorter time frames to the point that when an analyst brings up a longer time frame chart, they find it ridiculous. It is true that past performance does not indicate future results and things may very well be different this time. However, long term trends are very hard to change and even harder to manipulate. As the above weekly chart for XRP/USD shows, the price has just completed a bullish gartley pattern and has now found support at the top of its trend line once again since August.
Meanwhile, RSI for the above chart has been in a deep falling wedge that extends all the way back to late 2017. It will be very hard to influence the outcome at this point. Sure, the RSI may first break slightly below the falling wedge but long term it is expected to rise higher from here. If it were not to do that, it would mean invalidating years of patterns in technical analysis even for Ripple (XRP) itself. I understand that the sentiment right now is extremely bearish and many in the crypto community would rather wait to see which way it goes after the break out rather than buy or sell now and that is totally fine. However, it should be borne in mind that macro trends like these give us more realistic insights as to what to expect on smaller time frames. This is why it is important to not lose sight of the big picture when watching the price action on a 4H or daily time frame.
