


After our gold price forecast 2019 and silver price forecast 2019 which were both mildly to wildly bullish we are on record with a palladium price forecast 2019. The long term palladium price chart as well as palladium fundamentals suggest a bullish palladium price forecast for 2019, here is why.
We will revise the state of the physical palladium market, the palladium to gold ratio, the palladium weekly and monthly charts, before concluding a palladium price forecast for 2019.
Palladium price forecast 2019: physical industrial shortage
Demand for physical palladium is one of the important factors to consider especially because there is a global supply deficit since 2012. As per Maxwell Gold in this palladium market update deficits are expected to persist for the foreseeable future, but mining supply for 2018 is expected to be flat as a decrease in South Africa and Russia may be offset by a gain in output from Canada according to Metals Focus data.
The most important consumer of physical palladium is the car industry. Palladium is used in catalytic convertors that convert the harmful gases in car exhaust into less toxic substances.
According to R. Michael Jones, chief executive officer of Platinum Group Metals, “car demand is solid across the world, and trends are toward big SUVs in the U.S. and small gasoline engines in Asia. All of these are growing palladium demand.”
Specialty chemicals company Johnson Matthey calculated that physical demand for palladium exceeded supply in recent years:
- Demand exceeded supply in 2016 by 89,000.
- Demand exceeded supply in 2017 by 801,000 ounces.
- For 2018 the forecast to have another shortfall of 239,000 ounces.
The first chart visualizes the physical shortage in the palladium market. Note how the deficit became really significant after 2015. It puts the above figures in perspective. Since then the deficit is some 3,000,000 ounces.
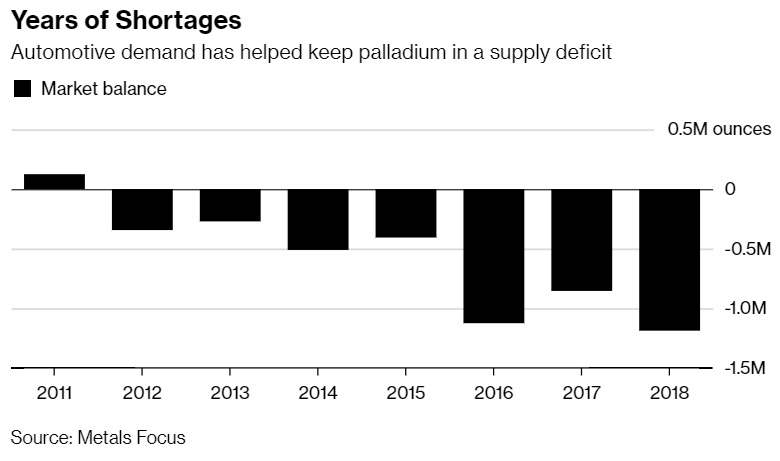
This obviously has an upward pressure to the price of palladium. Even after a structural deficit of 6 full years it is worth noting that the price did not go ballistic. But what if it happens, does the (car) industry have enough time to switch to alternatives?
Not really, says Johnson Matthey, as it would take at least 2 years before substitution starts to have a significant impact on palladium demand, as per this Reuters article.
Palladium price forecast 2019: physical investment demand
Physical industrial demand for palladium may have shown structural deficits but still price did not react accordingly.
Part of the answer to this ‘mystery’ is to be found in the massive ETF outflows of physical palladium.
Whether this implies that palladium investment demand has weakened or not is irrelevant in this context, we just focus on physical flows.
Bloomberg noted that palladium ETF holdings have moved almost opposite to prices in recent years. “Since August 2014, investors have cut holdings by 71 percent, selling $2.3 billion of metal.”.
This becomes clear on below chart, courtesy of Sharelynx. The chart shows all physical palladium held by all palladium ETFs. Note how the volume of physical palladium held by ETFs literally crashed since 2014 from 3,500,000 ounces to 1,000,000 ounces today.
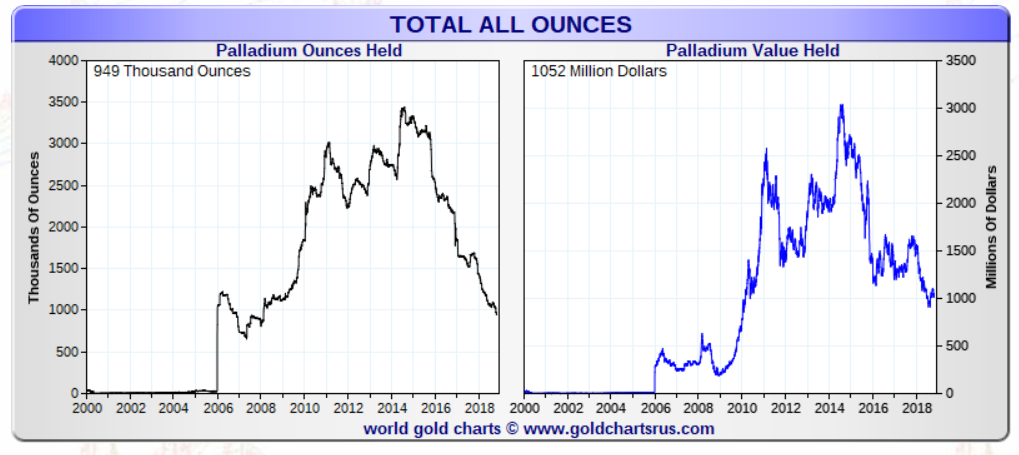
Well, this is very interesting, as the 2,400,000 ounces that left palladium ETFs since 2015 lines up nicely with the 3,000,000 ounces deficit shown in the first chart above (industrial shortage).
Does it mean that the palladium ETF outflow was meant to close the gap of the supply deficit in the car industry (first chart)? We did not conduct the market research but the figures suggest the answer is yet.
But it seems that in 2019 the ETF outflow will have reached its limit, and the physical shortage will have no easy to fill the gap. What does this mean? All the conditions for a very bullish palladium price forecast for 2019.
Palladium to gold ratio as 2019 kicks off
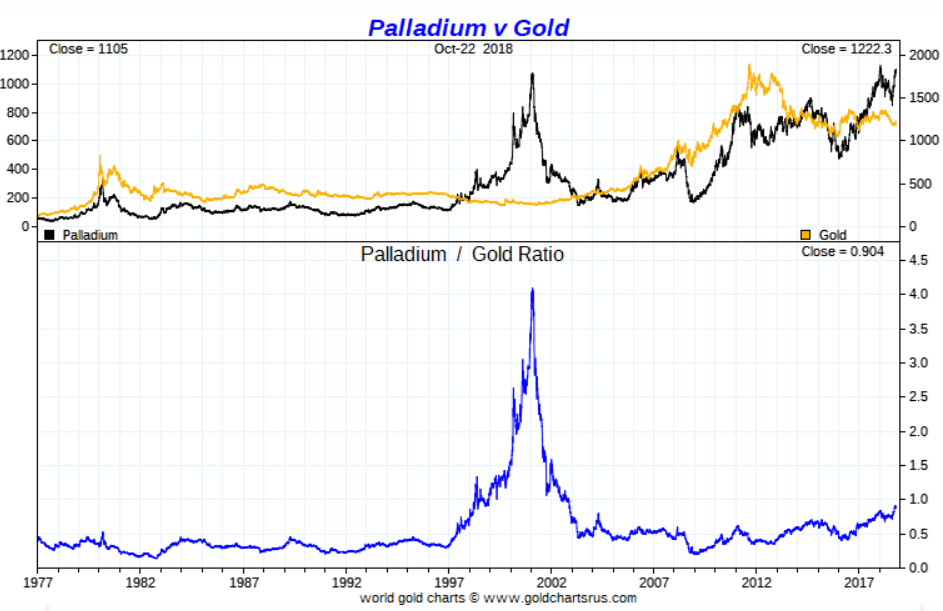
At the same time, palladium prices are gaining on gold. Ed Egilinsky, head of alternative investments at Direxion, says that the historical, long-term relationship between gold and palladium is that gold is priced 2 to 3 times higher than palladium. The current ratio is a little over one. “It is possible for palladium to trade higher than gold if palladium supply continues to be muted, demand for autos and electronics increases, and tighter emission legislation further takes hold in China and the U.S.”
If we reverse this, and look at the historical palladium to gold ratio, we see an extremely enticing pattern. In chart terms it is called a rounding bottom. This one, particularly, spans over 15 years. That’s not your normal rounding bottom, it’s a giant formation.
Here is the big news: this rounding bottom is breaking out this year, and seems to be set to continue this trend in 2019. That’s a secondary indicator for us to conclude that our palladium price forecast for 2019 should be very bullish.
Moreover, gold seems to be setting up for a constructive period. Our best guess is that October till April will be mildly to wildly bullish depending on how the outflow from the bond market will play out.
In a gold friendly environment it certainly helps palladium prices move higher.
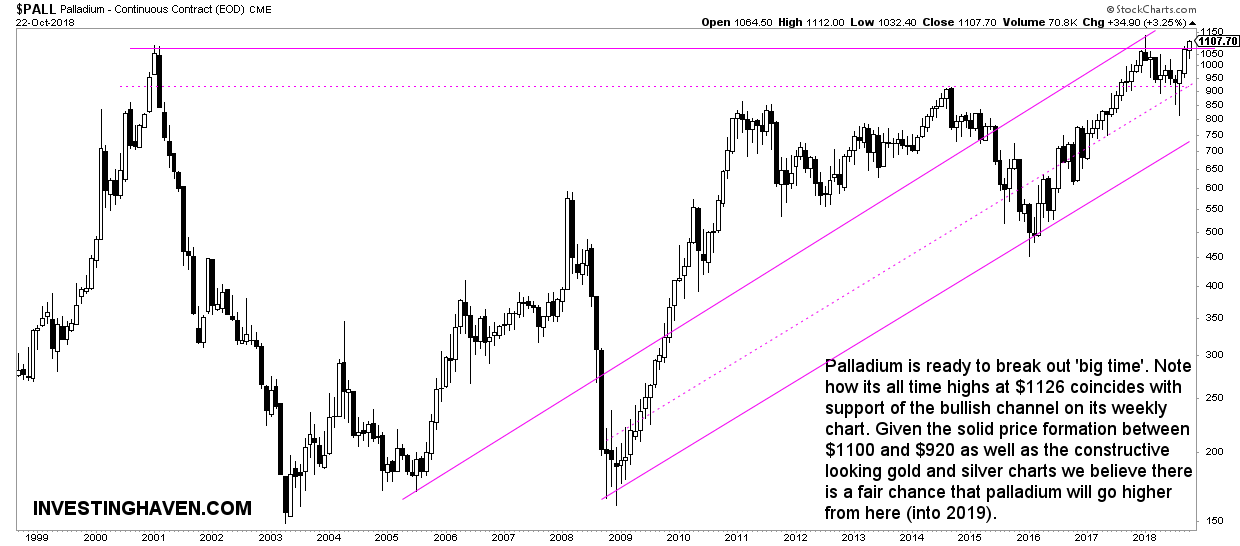
Palladium price forecast 2019: weekly chart
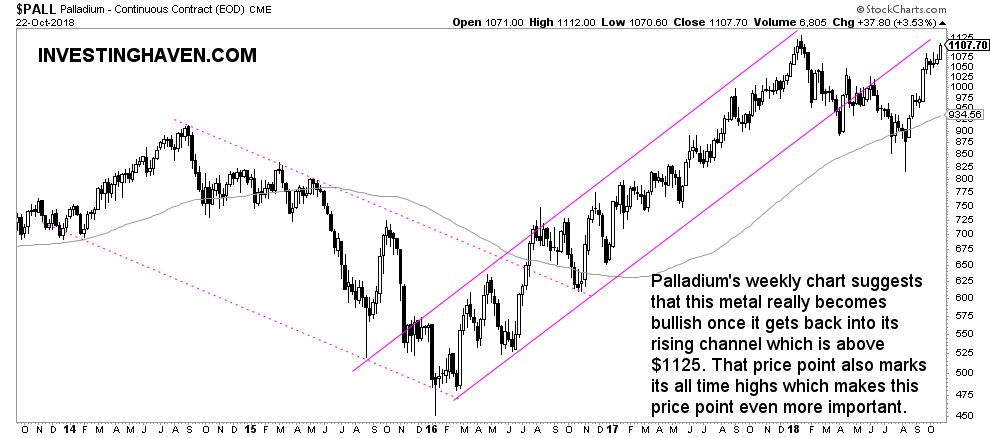
The weekly palladium chart has one falling channel and one rising channel. Earlier this year, in the May-June timeframe, the rising channel was invalidated. However, palladium is working hard now to get back in its rising channel.
Here is our conclusion: the $1125 price point is crucial for our palladium price forecast for 2019. Once above $1125 palladium is back in its rising channel. That is very bullish. On the other hand the all-time highs are $1125, so a break above it would be a secular breakout.
Palladium price forecast 2019: monthly chart
The monthly palladium chart confirms on the one hand the importance of the $1125 price level, in line with the findings on the weekly chart.
What the monthly adds as an additional insight is that a solid area was built in the $1100 to $920 area. That’s fundamentally different as the previous 2 instances when all-time highs were set: once in 2000 and once in 2017. Both were almost parabolic rallies which obviously were not sustainable.
The current rally, however, has some good foundation to build upon. We believe ‘this time is different’.
Palladium price forecast 2019: a price forecast
With a supply deficit which is building up for 5 years, with a massive physical palladium exodus from ETFs which is reaching its limits, in a gold friendly environment, we see several primary and secondary indicators suggesting at much higher palladium prices to come in 2019.
The weekly and monthly palladium charts suggest a secular breakout is in the making. Moreover, the palladium to gold ratio, as a secondary indicator, is breaking out as well.
Platinum Group Metals’ Jones believes that palladium could climb to $1,200 this year and $1,400 in 2019 and wouldn’t need a new “catalyst” to get there.
InvestingHaven’s research team is on record with a palladium price forecast for 2019 of $1375 which likely will be a medium to long term top. It certainly is a profit taking price level if and once it gets there.
Our thesis is invalidated if the $1125 does not get broken to the upside, or if a breakout appears to fail.
TOP CRYPTOCURRENCIES TO BUY: InvestingHaven’s top crypto tips are in a “buy zone”. Top notch guidance on how to play the grand bull market in crypto from InvestingHaven’s research team, only for $2 per week. Crypto & Blockchain investing service >>

