


As Bitcoin (BTC) closes out the week and moves towards the end of October, we take a look at what’s going on with price action in what has been an anticlimactic month.
4 Hour Chart
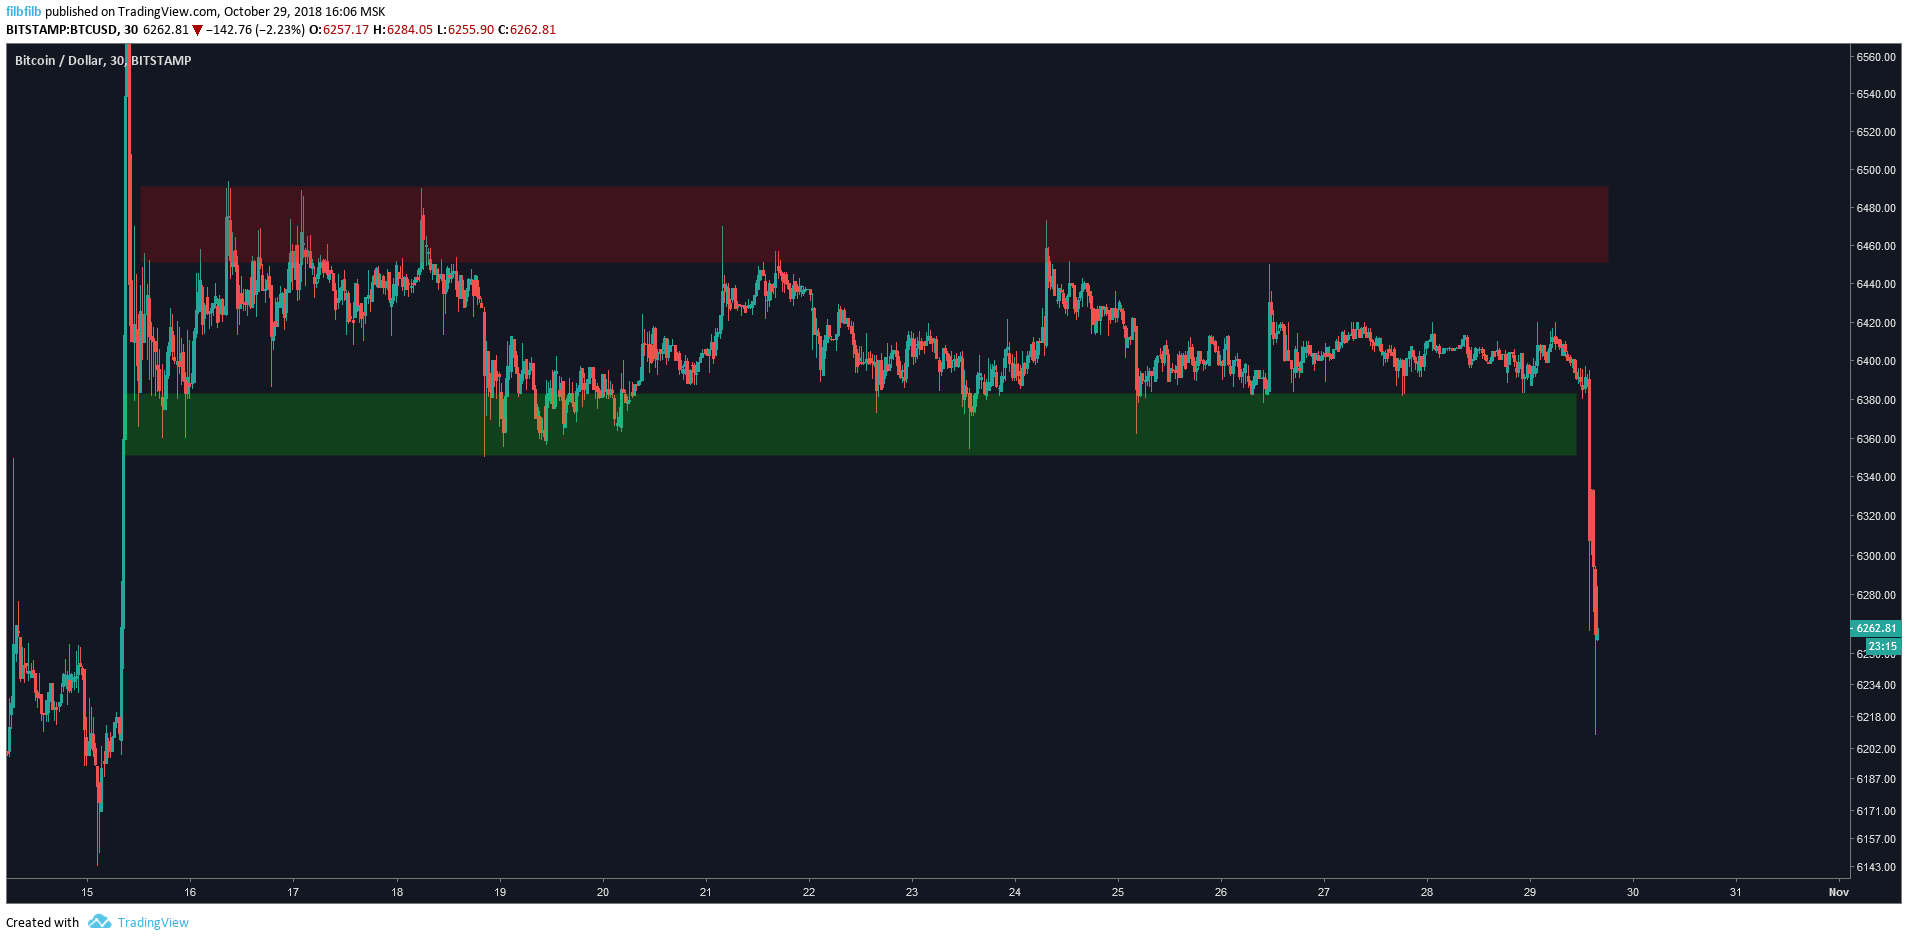
Bitcoin had been firmly locked in a single trading range for over two weeks, with lows of $6450 and highs of $6490.
This morning, we finally broke out of this range with the bears taking us back to $6200, from where the original break to the upside occurred, completing another so-called ‘Bart’ style reversal. This reversal, although finally breaking a two-week consolidation, is a modest drop back to retest support from which price quickly bounced around $100 back to $6300.
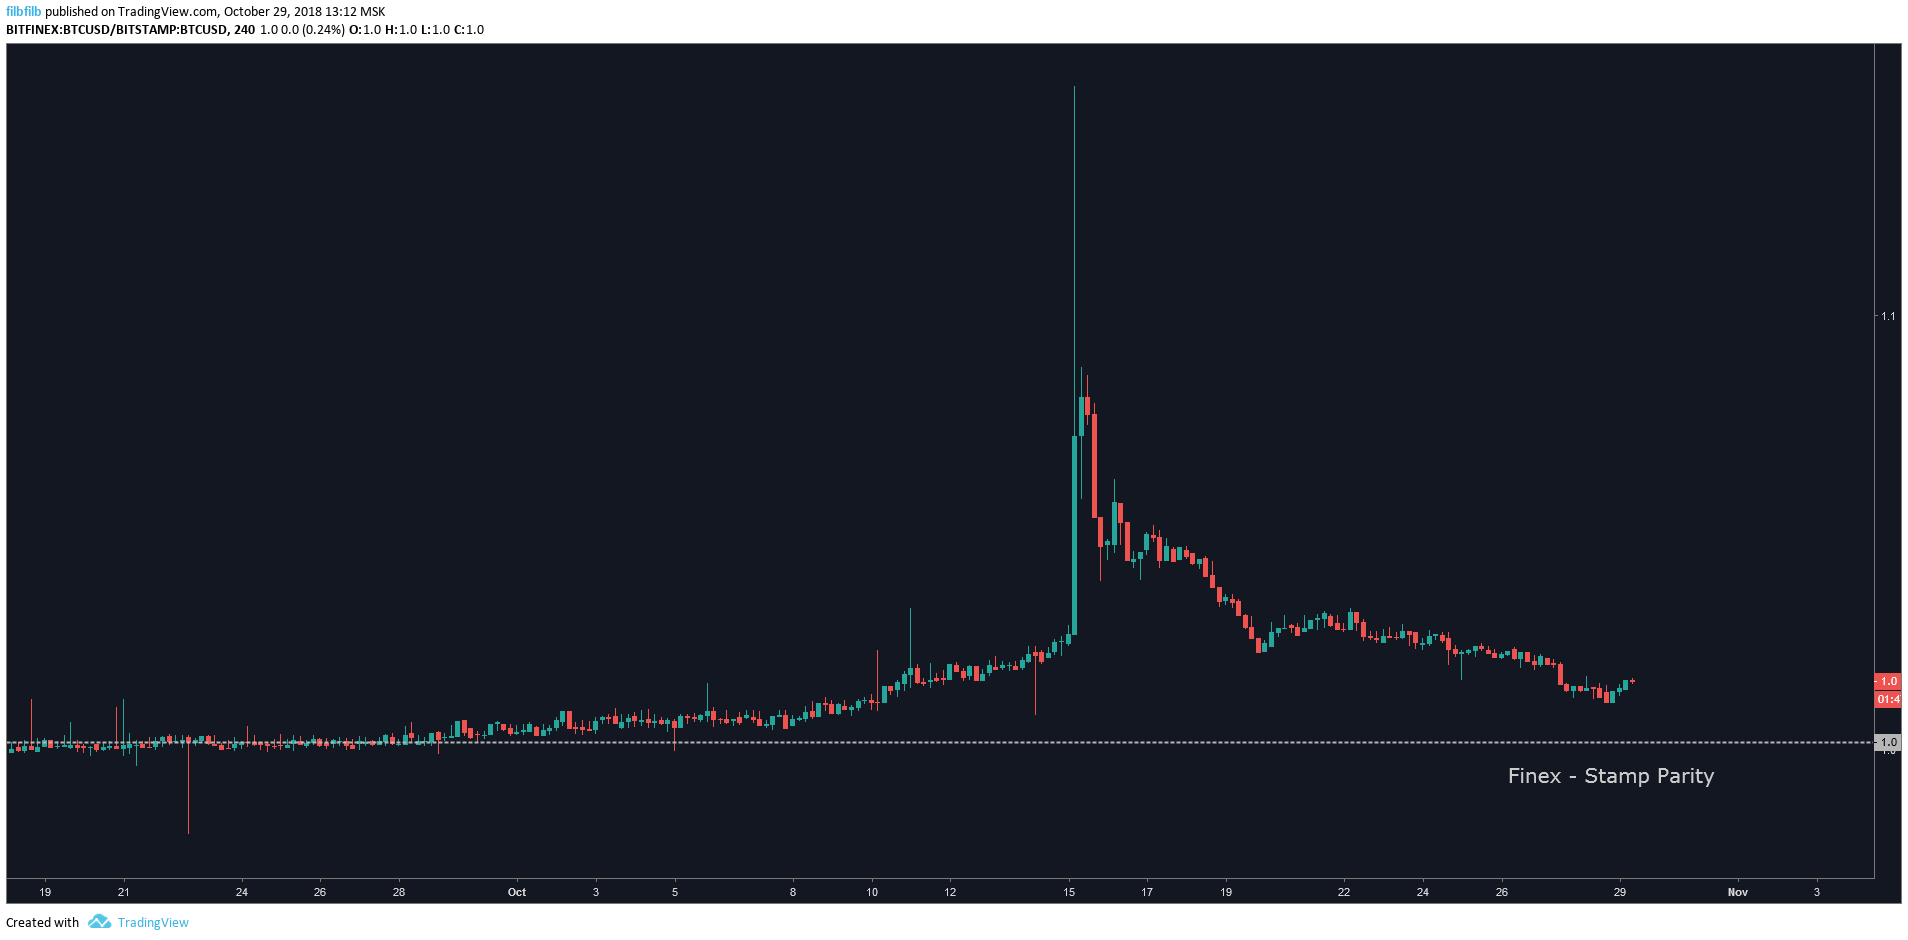
This range is largely a continuation of that found amidst uncertainty in the market around Tether (USDT) and Bitfinex. The Bitfinex risk premium is slowly evaporating from highs of 15 percent down to 1.5 percent as calm is restored and traders take advantage of arbitrage opportunities.
Meanwhile, the stock market continues to wobble and as the 2018 long term diagonal resistance fast approaches.
The phrase “a move is coming” has become somewhat of a meme amongst traders as nothing continues to happen; at a time where volatility is expected to peak, it’s in fact continuing to reach for all-time lows. While this $200 move to the downside shows a much-needed increase in volatility for traders, it is not ‘the’ move which the market is waiting for, although it could be a catalyst for a bigger move.
1 Day Chart
Bollinger Bands can be used to measure price volatility of an asset. The bands are calculated around a 20 period moving average, with the outer bands usually being set 2 standard deviations above and below the middle band.
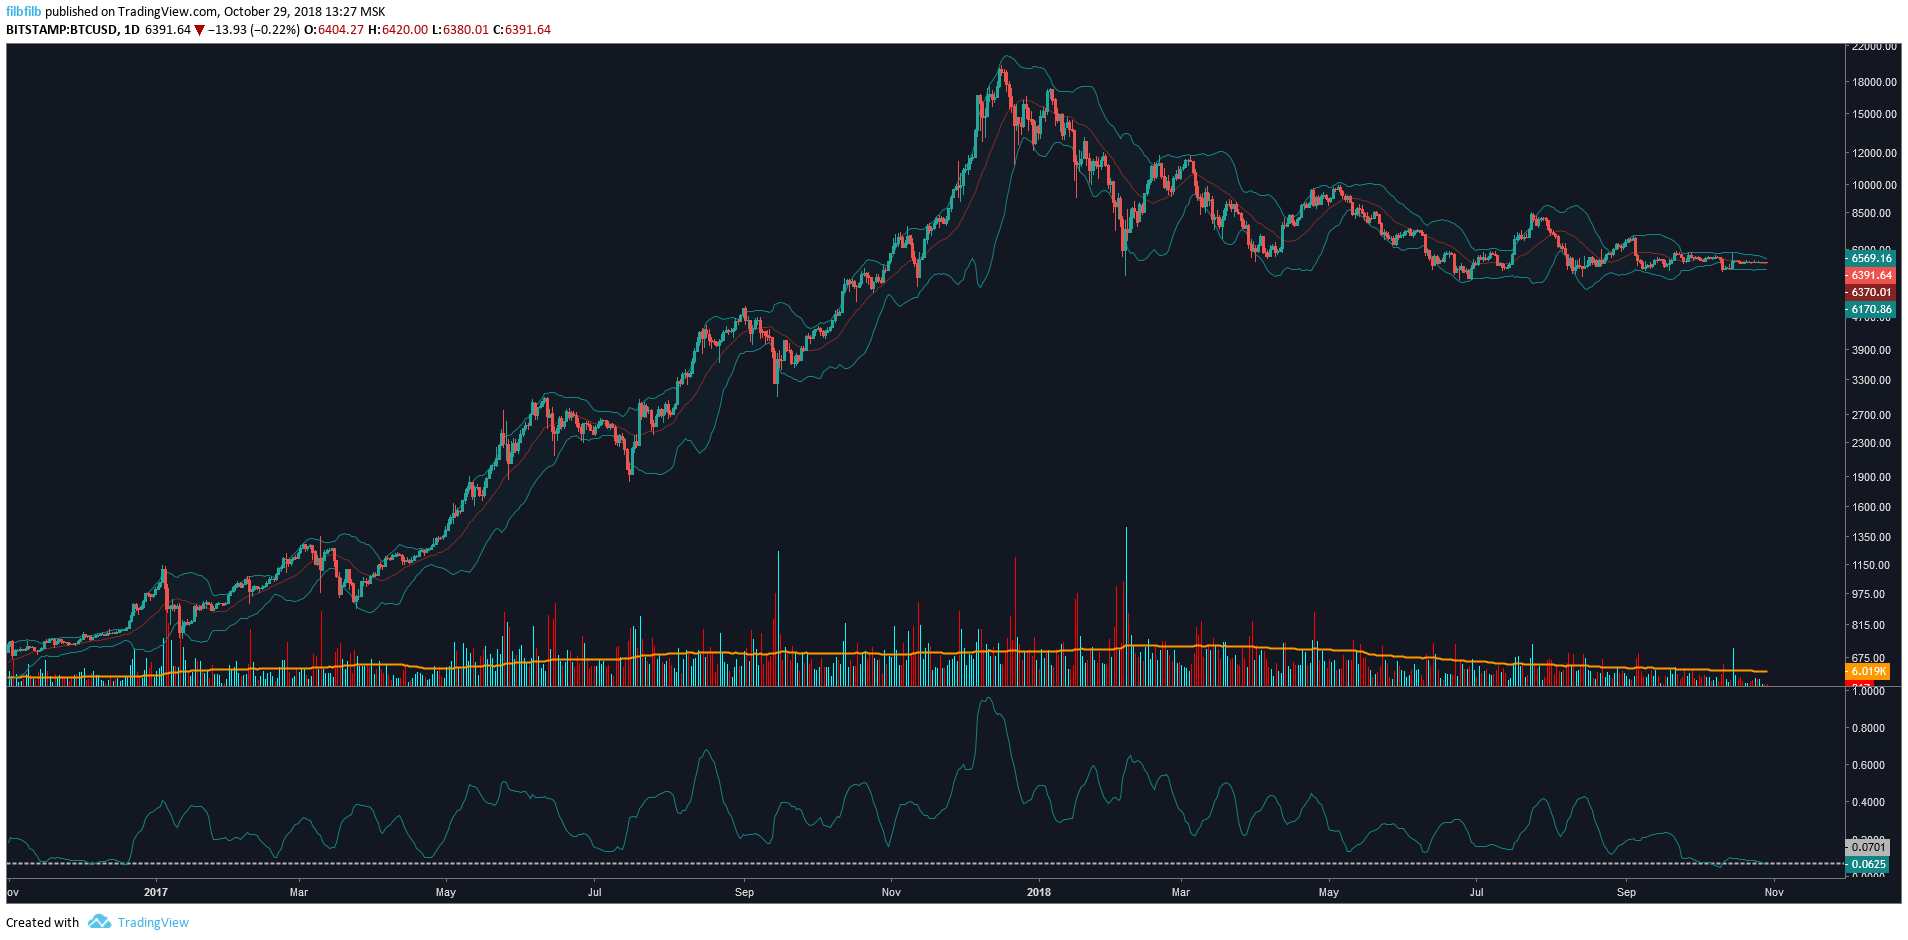
The daily chart is showing the Bollinger bands tighten meaning Bitcoin is hitting the lowest period of volatility since the price was around $750. As the bands tighten, the probability of a move increases; ‘contraction leads to expansion,’ hence why traders are patiently waiting, not wanting to be caught on the wrong side of a large volatile move.
Traders are looking for an indication as to where Bitcoin wants to travel before entering the market. This indication will come in the form of a clean break out which closes above $7400, or a break below $5800, accompanied by a volume spike. Those more prudent will await for several candles confirming the direction, or a successful retest of the breakout. This ‘wait and see’ capital will ultimately enter the market and along with stop and liquidation entries, result in a fast move.
Weekly and Monthly chart
Both the weekly and monthly charts are showing price action flattening out. The weekly chart shows the smallest of doji indecision candles, with last week highs of $6473 and lows of $6354. The early test of support in the week will set the tone as we head towards the mid-week monthly close out.
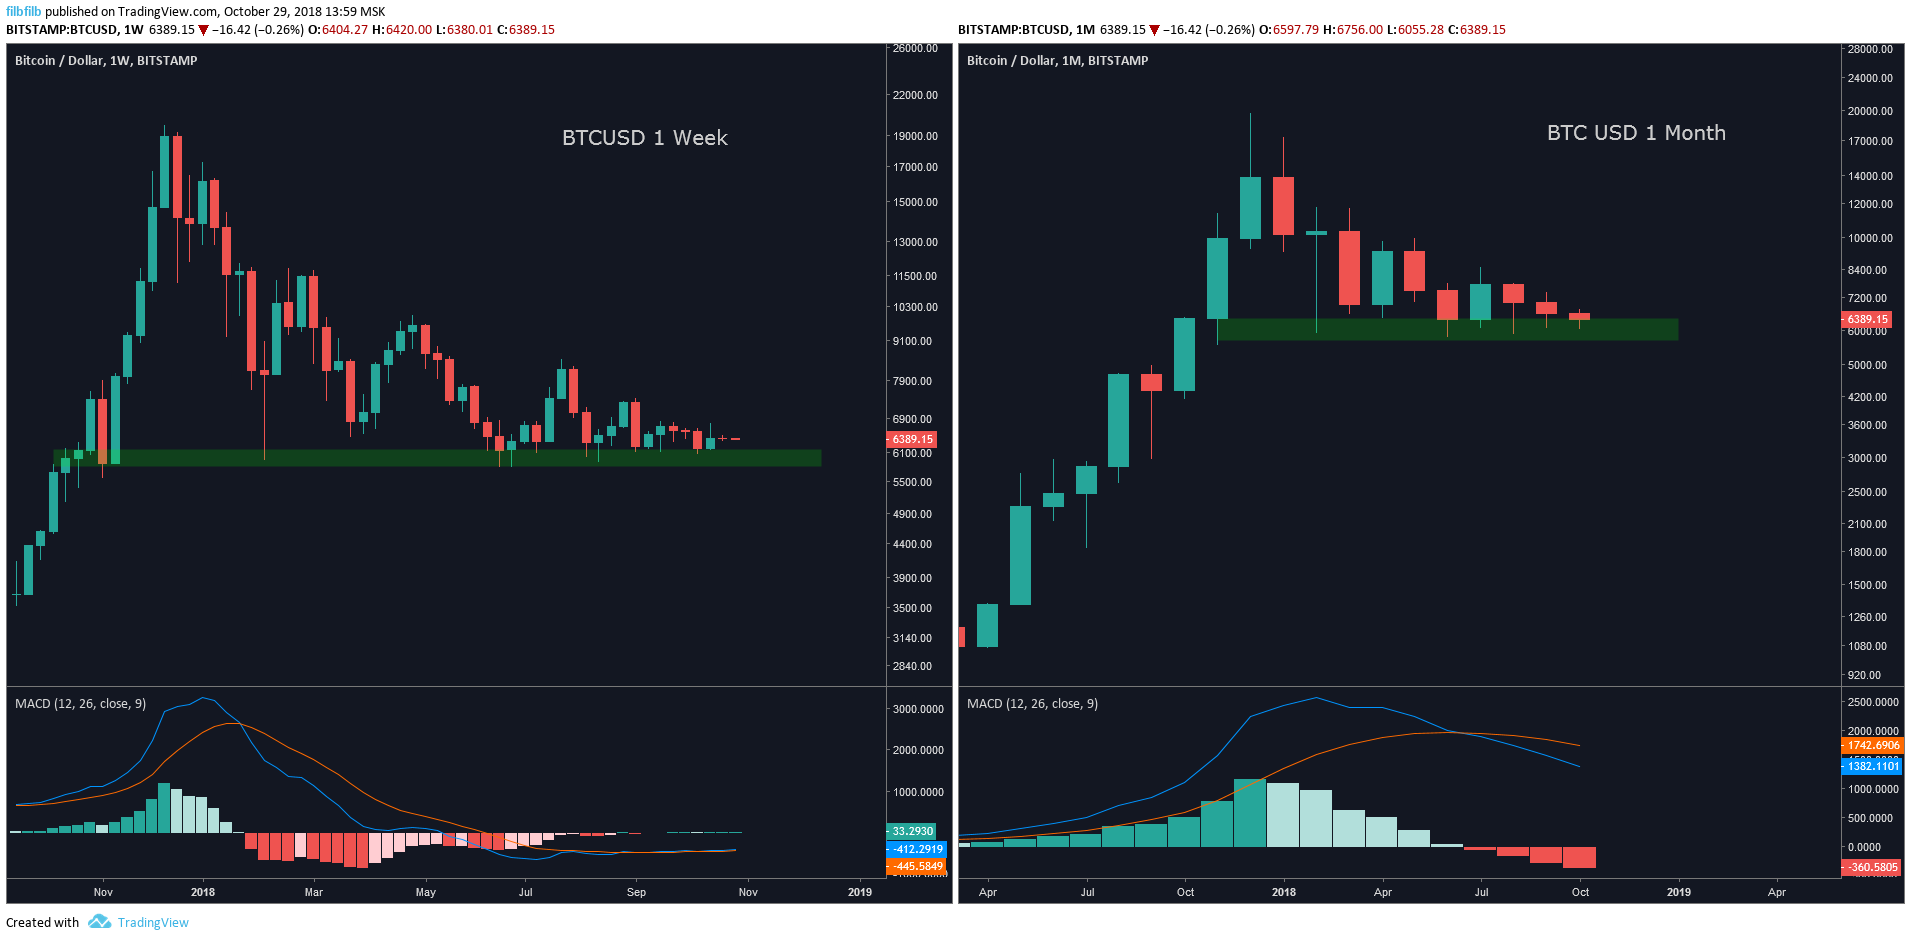
The Monthly picture shows that the bears are still in control in this market and without a break above $6600, will mark a third consecutive month of price decline. Although the bears are successfully pushing the price down, the bulls are responding by keeping the price in the mid $6ks.
Bitcoin has also reached a pinch point with both is down trend of 2018 meeting the uptrend of 2016-17 as I point out on Twitter. The ‘return to the mean’ line following a parabolic advance now stands around $5k which is the target for many bears.
Quick look at the parabolic $btc chart.
The mean line is now at c.$5k.
The two accompanying pitchforks say we already reached the pivot.
Definitely room to test $5k but as each day passes the probability of lower prices diminishes.
Inevitability has a habit of catching up. pic.twitter.com/OJjTkXI49q
— fil₿fil₿ (@filbfilb) October 28, 2018
All of this is happening ahead of the awaited Bakkt futures launch in December which settles with physical settlement and amidst bullish fundamentals for on ramps and bearish fundamental indicators around Bitcoin Money Velocity.
What Bakkt will do to price remains to be seen but its not beyond the realms of possibility that some participants are awaiting this product to enter the market.
When will the real volatility come? What will be the spark that reignites the crypto market? Let us know your thoughts in the comments below.
[Disclaimer: The views expressed in this article are the personal opinion of the author and do not reflect the views of Bitcoinist. The information in the article should not be taken as financial advice.]
To get receive updates for the writer you can follow on Twitter (@filbfilb) and TradingView. Images courtesy of Tradingview, Shutterstock.


