


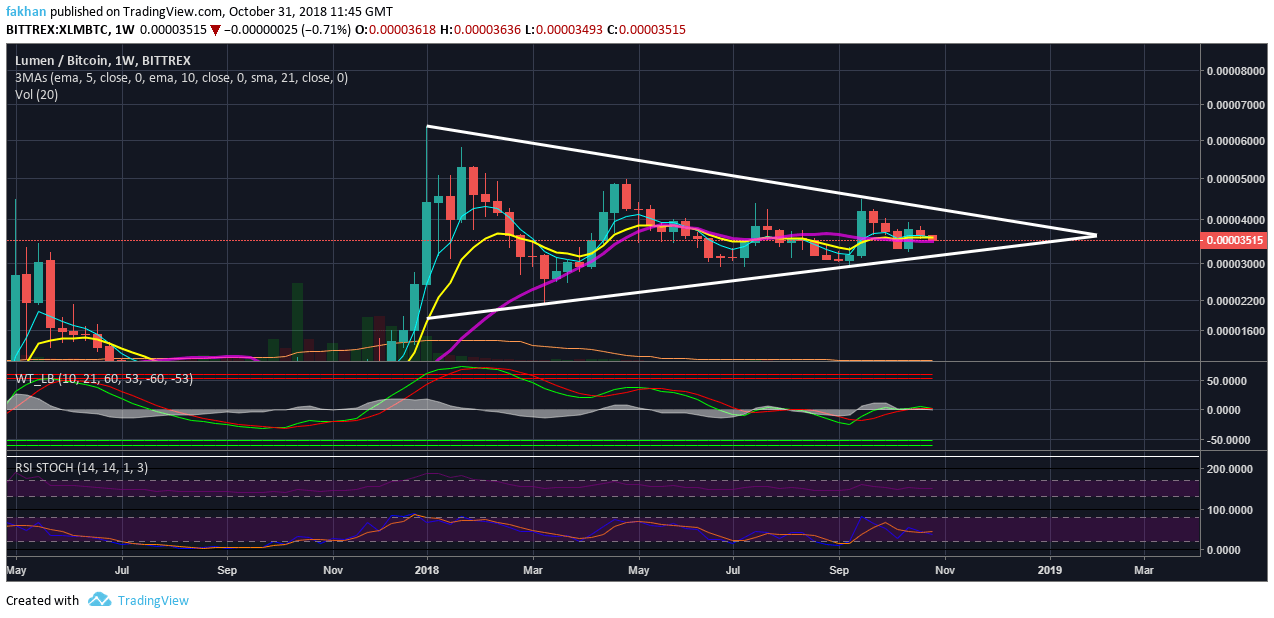
Stellar (XLM) has been in the same dilemma as Bitcoin (BTC). For the last few days, there has been no clear direction for XLM/BTC. The big picture however tells a different story. The weekly chart for Stellar (XLM) against Bitcoin (BTC) shows that the price might be consolidating above the trend line, preparing for a big move to the upside. However, the big swings that we have seen since the beginning of the correction seem to have run their course. As the swings have become incredibly short ranged, it is likely that Stellar (XLM) will continue with the same boring price action till the end of the year.
The bullish pennant that Stellar (XLM) is currently trading in against Bitcoin (BTC) might ultimately break to the upside. However, it has a lot of room for further sideways action till early 2019. So, if XLM/BTC just starts forming weekly candles in a straight line, it would not have to do anything decisive till the end of the year. On surface, this may not seem like a positive development. However, the fact remains that almost all cryptocurrencies with the exception of stable coins mimic the price action of Bitcoin (BTC). The price of Bitcoin (BTC) has yet to touch the bottom of its ascending channel. If the price of Bitcoin (BTC) continues to trade sideways till the end of the year, it might be able to touch the bottom of that channel after which a new cycle can begin.
Certainly a new cycle could begin before Bitcoin (BTC) retests the bottom of that ascending channel. As the XLM/BTC weekly chart shows, the 10 Week EMA is already above the 21 Week EMA. If the circumstances were different, this would be an incredibly bullish development. However, under the present circumstances, Stellar (XLM)’s next big move depends on Bitcoin (BTC) which does not seem to be in any rush. There is a lot of Bitcoin (BTC) buying going on most of which is happening over the counter. That means that the price of Bitcoin (BTC) is expected to remain range bound for the foreseeable future. Therefore, Stellar (XLM) can be expected to do the same and the price may keep trading in the bullish channel till the end of the year.
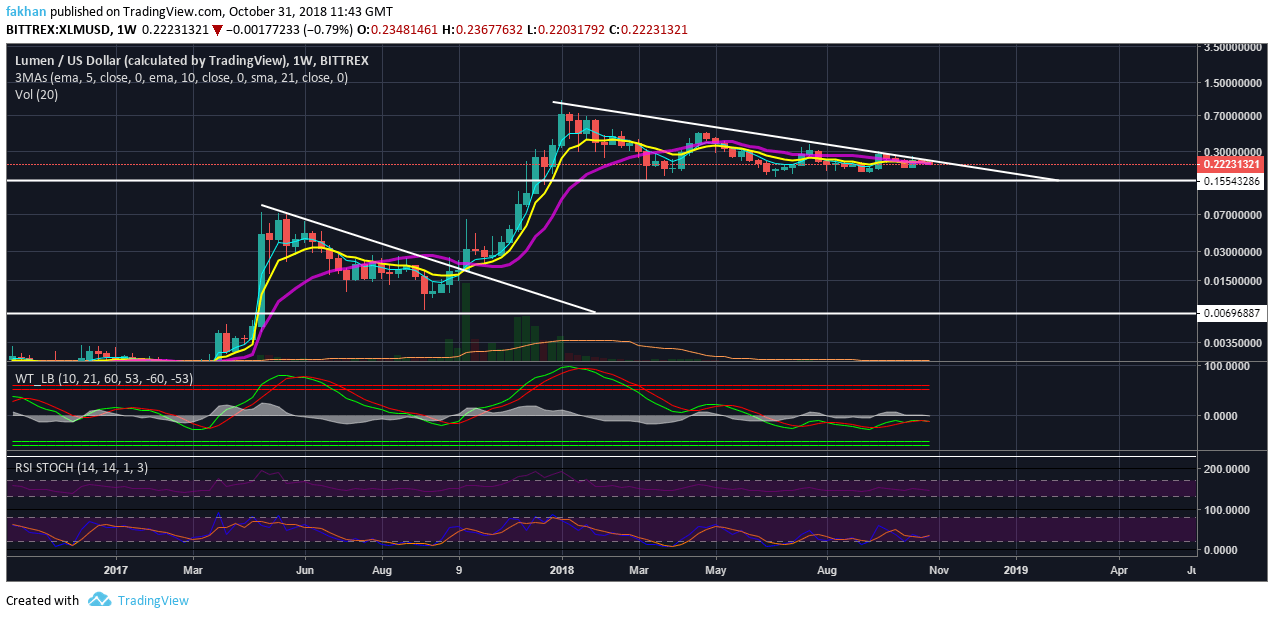
Cryptocurrencies like Stellar (XLM) and Ripple (XRP) are known for their wild moves. Investors in Stellar (XLM) just like Ripple (XRP) hodlers are running out of patience. The price action on the above chart for XLM/USD clearly shows that the 10 Week EMA has crossed above the 21 Week EMA. Yet the price continues to remain range bound. If this were any other asset like a stock or forex pair, we would have seen a massive break out and the beginning of a new cycle. It is likely that we may see the same with Stellar (XLM) but as long as Bitcoin (BTC) remains range bound, all bets are off. Recent price action in case of both Stellar (XLM) and Ripple (XRP) has shown us that without the blessing of Bitcoin (BTC) any independent moves made are inconsequential and short-lived.


