


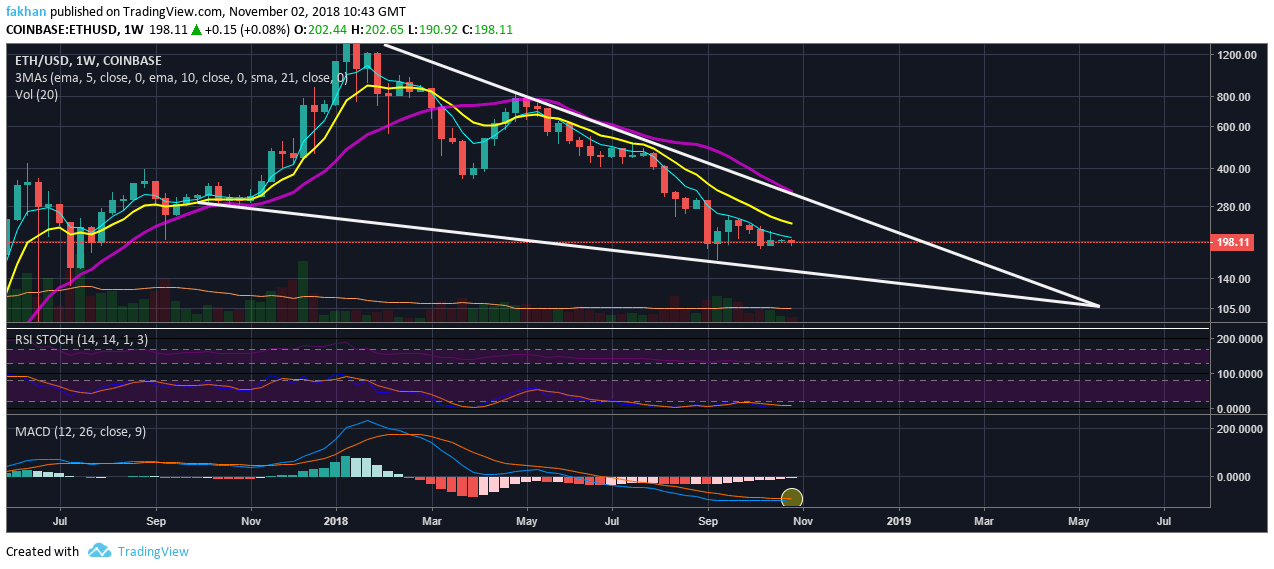
Ethereum (ETH) is on the brink of a trend reversal. If we look at the candles on the ETH/USD weekly chart, the odds of a breakout do not appear very plausible. The 10 Week EMA is still quite far from the 21 Week EMA. The price is trading below the 5 Week EMA and has not been able to climb above it for the last 20 weeks. However, if we look at the technical indicators, we see something that we have not seen since the beginning of the correction. If we look at the blue and red lines on the MACD profile for the ETH/USD weekly chart, we can see that these lines have never been this close since the beginning of the correction.
Put simply, when the blue lines of MACD cross above the red line, we see a rise in the price of Ethereum (ETH). However, when the blue line has been below the red line since the beginning of the correction, a cross over at this point would be a sign of trend reversal. Both of these lines started to converge around September but this is the first time they have gotten so close. The significance of this development is that the bulls do not need much to change the moment in their favor from here on out. If we look at the ETH/USD price, it has failed to climb above the 5 Week EMA since May. It is only going to take one strong candle to push it above the 5 Week EMA at this point.
If the price of ETH/USD rises and closes above the 5 Week EMA, it would be the first sign of a trend reversal. At that moment, a lot of new buyers would rush into the market. Majority of Ethereum (ETH) bears will close their short positions as well and we would see a strong trend reversal. If the price continues to remain below the 5 Week EMA, then it can fall to the bottom of the falling wedge. In that case, we may see the price continue to fall towards the bottom of the wedge till the end of the year. Frankly, there is not much room for further downside at this point. The only reason the price could fall aggressively from here is if we were to enter another correction which seems unlikely.
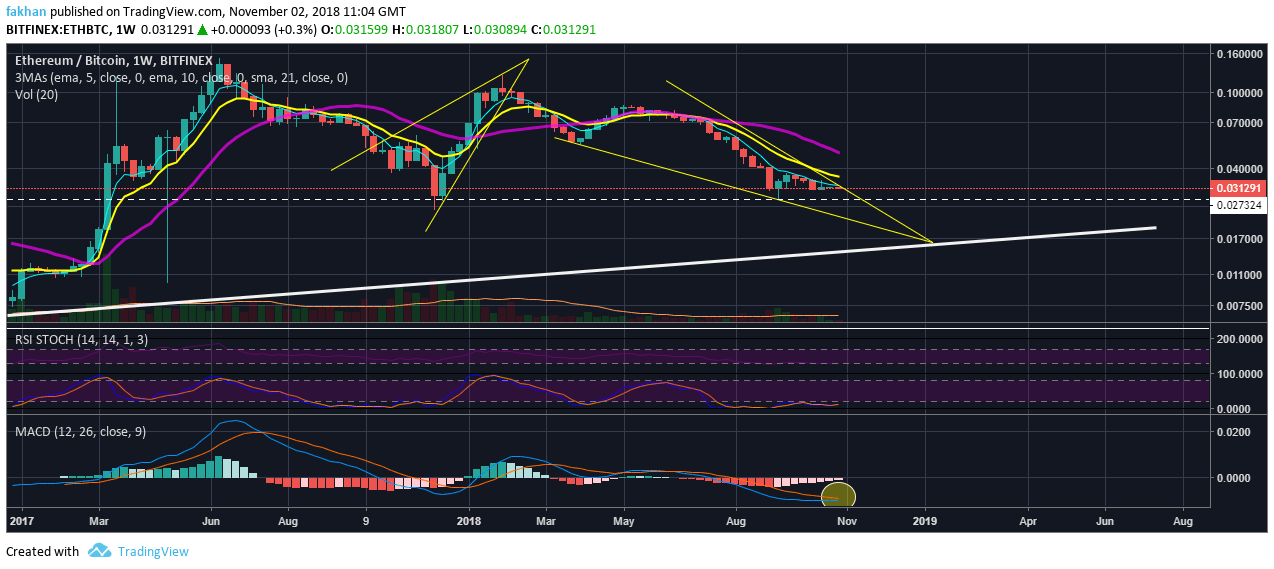
Ethereum (ETH) has also run the full course of a correction against Bitcoin (BTC). The falling wedge ETH/BTC is trading in, suggests two possibilities. Either the price could break the falling wedge and begin a new cycle or the price could break the support and begin another correction. Both of these events are possible but a breakout to the upside from the falling wedge is more probable. Just as with ETH/USD, the MACD profile shows a strong possibility of trend reversal in the weeks ahead. As we have seen previously, ETH/BTC trades in an alternating series of rising and falling wedges. If the price breaks out of this falling wedge, we will see at entering a new rising wedge which will take it to its new all time high in the years to come.
