


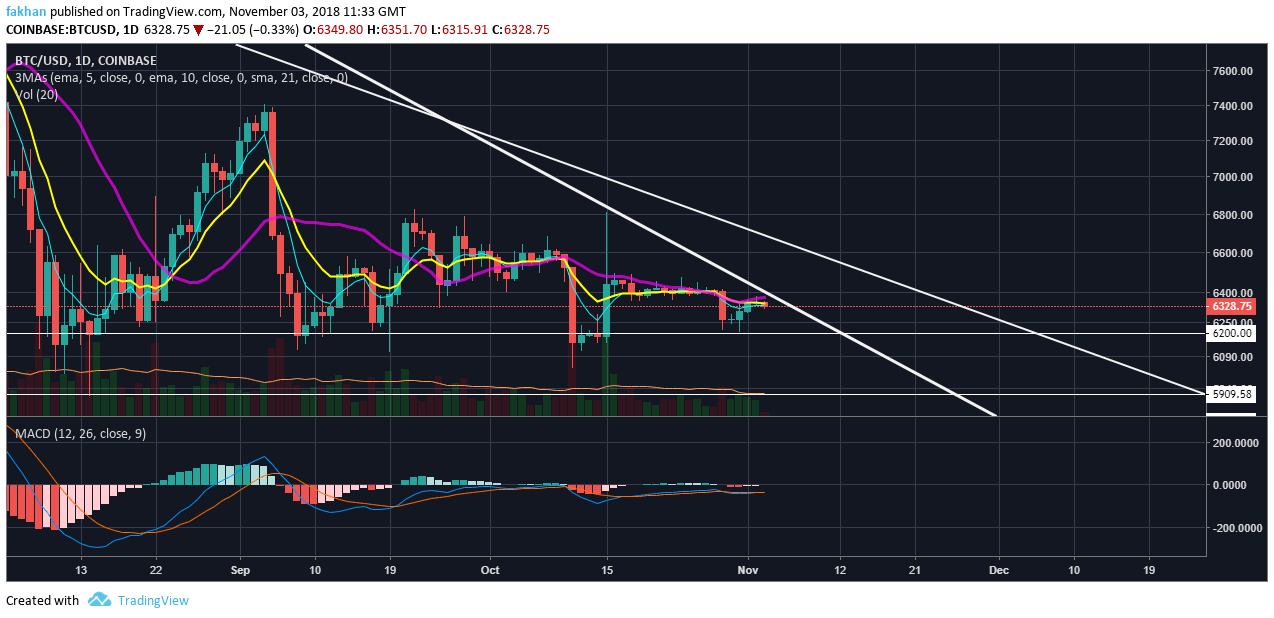
Bitcoin (BTC) has just faced rejection at a long term resistance. The price has now broken below the 5 Day EMA and looks likely to drop further. If today’s daily candle closes below the 5 Day EMA, we will see Bitcoin (BTC) retesting $6,200 again. If that level fails to hold, then we may even see the price drop further to $5,800. In any case, Bitcoin (BTC) will be expected to bounce off these levels with strength as it has in the past. BTC/USD tested $5,900 around mid August but bounced strongly off that level. After that, the price rallied all the way to $7,400. If Bitcoin (BTC) falls to $6,200 or lower and bounces from there, it would become easier for the bulls to break the long term resistance.
Technical indicators have been in favor of a trend reversal since mid October. This is why we saw the price shoot straight up to the downtrend line. The price could not keep its bullish momentum and retraced heavily to settle below the 21 Day EMA. However, it did deliver a strong message that the bulls are ready to break the downtrend resistance. When the price tested the downtrend line at the beginning of November, it could have pierced straight through it. However, this time the bulls were more cautious and did not want anyone dumping on them. The same sentiment is likely to prevail until Bitcoin (BTC) reaches the extreme end of the long term triangle. In that case, it would not require much to break the downtrend and the rally will have a higher probability of being sustainable.
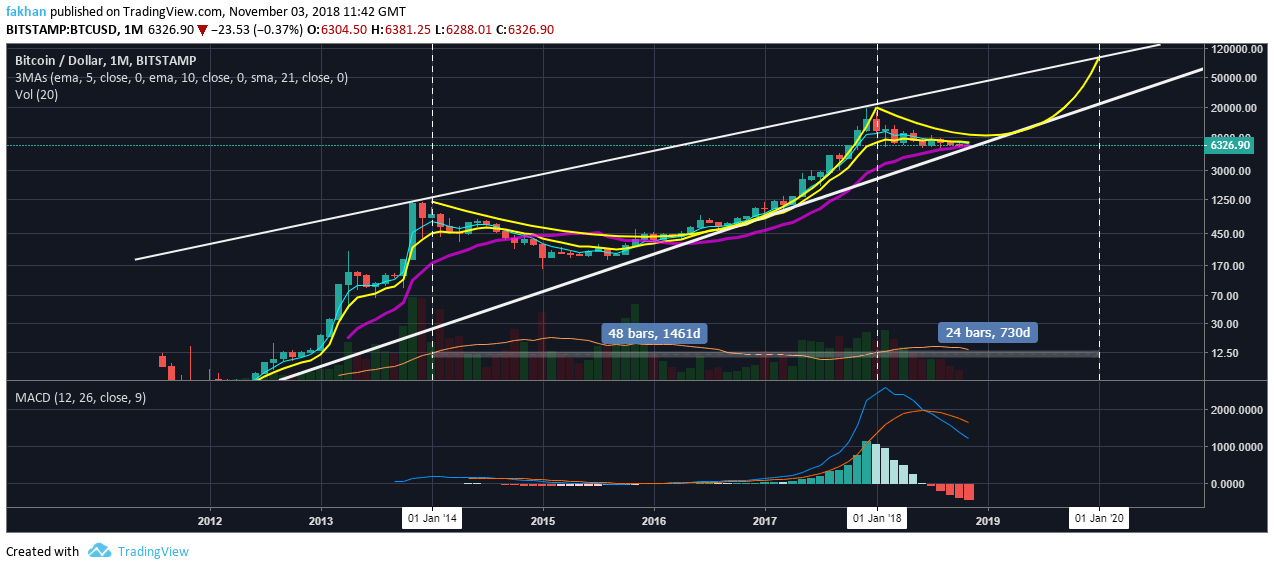
Even though a trend reversal is imminent, the bullish confidence will take a long time to be fully restored. As the price continues to rise towards $10,000, we will see investors profit taking or breaking even along the way. Some may want to buy the stock market dip and would cash out. The institutional investors are not going to buy on exchanges so it is unlikely that they will help restore confidence. Certainly, there are catalysts like Baakt and ETF approvals that might help turn the sentiment in favor of the bulls. However, it has become clear recently that the price is unlikely to surpass its previous all time high before mid 2019. If we consider the effect of halvening, we will see that every Bitcoin (BTC) cycle is reduced by half. One entire cycle was completed recently between 2014 and 2018. It lasted a period of four years.
Interestingly enough, BTC/USD seems to have completed its correction which lasted half the duration of the previous cycle. It is therefore reasonable to assume that the remaining two segments of the ongoing cycle i.e. the gradual rise and the aggressive rise will also last half the duration of the respective segments of the previous cycle. If this comes to fruition, we may see a price of $60,000 or higher per Bitcoin (BTC) by January 2020. If Bitcoin (BTC) trades with this pace, it is likely to prove prominent Bitcoin (BTC) maximalist John McAfee wrong and we may be able to see something very interesting. However, it may still prove Tim Draper right who has a target of $250,000 for Bitcoin by 2022 and had previously predicted (in September 2014) that Bitcoin (BTC) will hit $10,000 in 2018.
