


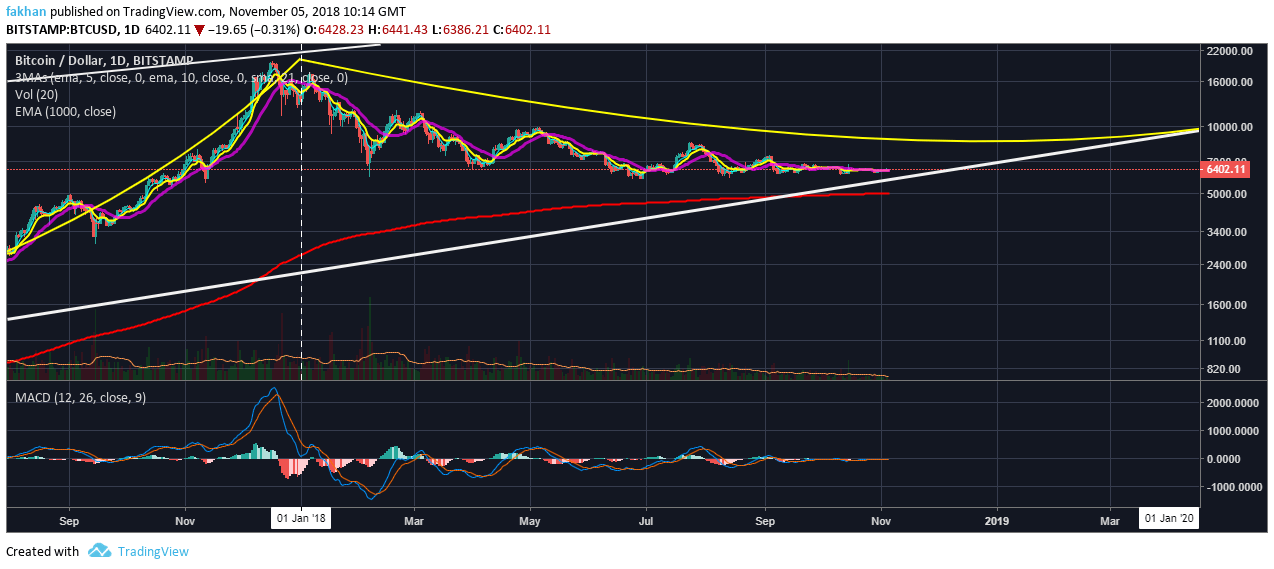
Bitcoin (BTC) bulls may not seem aggressive but they are definitely more determined than the bears. Most bulls are confident in Bitcoin (BTC)’s long term growth as long as the price remains above the 1000 Day EMA. As the BTC/USD daily chart shows, the price is currently well above the 1000 Day EMA and is not likely to fall below it under the bullish case. Before the month of September, if the price would fall to the 1000 Day EMA, it would coincide with the long term trend line. However, this time, if the price falls back to the 1000 Day EMA, it would have to fall below the trend line. It is pertinent to note that a fall below the trend line and a fall below the 1000 Day EMA do not mean the same thing.
If the price falls below the trend line, it does not make way for a bearish setup. It may still be possible for Bitcoin (BTC) to climb back above the trend line. However, if the price falls and closes below the 1000 Day EMA, all bets are off. Please remember at this point that we are making these analyses on the basis of the daily chart which most people use. The weekly and monthly charts point to different conclusions. Throughout this correction, we have seen the price remain above the 1000 Day EMA. Throughout the history of Bitcoin (BTC) whenever the price has remained above the 1000 Day EMA, we have seen a bullish continuation. At stages where the price has broken above the 1000 Day EMA, we have seen a major break out and the beginning of a bullish cycle.
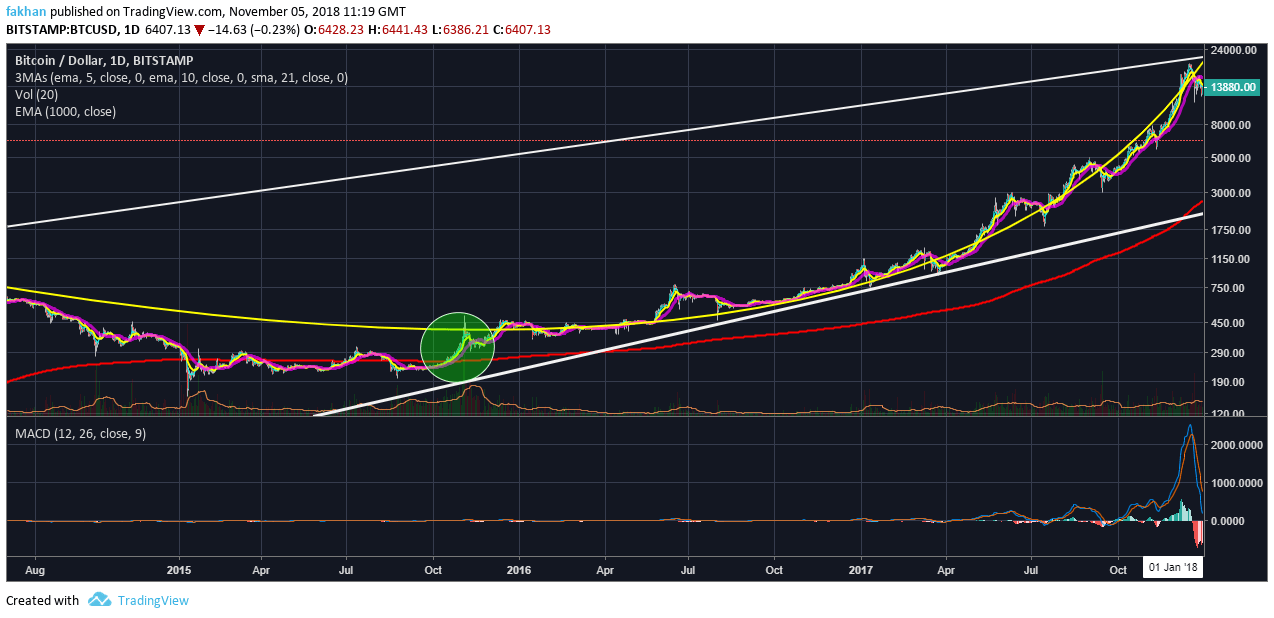
The above BTC/USD daily chart from 2015 shows how the price action turned very bullish all of a sudden soon as Bitcoin (BTC) broke above the 1000 Day EMA. As long as the price remained above the 1000 Day EMA, Bitcoin (BTC) kept on surging until it reached its all time high around $20,000. The price has still not plunged below the 1000 Day EMA, but if we look at the past, even a plunge below the 1000 Day EMA is only going to delay the next cycle. It does not mean that a bearish setup will come into play and the price will fall significantly. During January 2015 and September 2015, the price of Bitcoin (BTC) struggled to break decisively above the 1000 Day EMA, but it failed. This delayed the beginning of a new cycle by almost eight months.
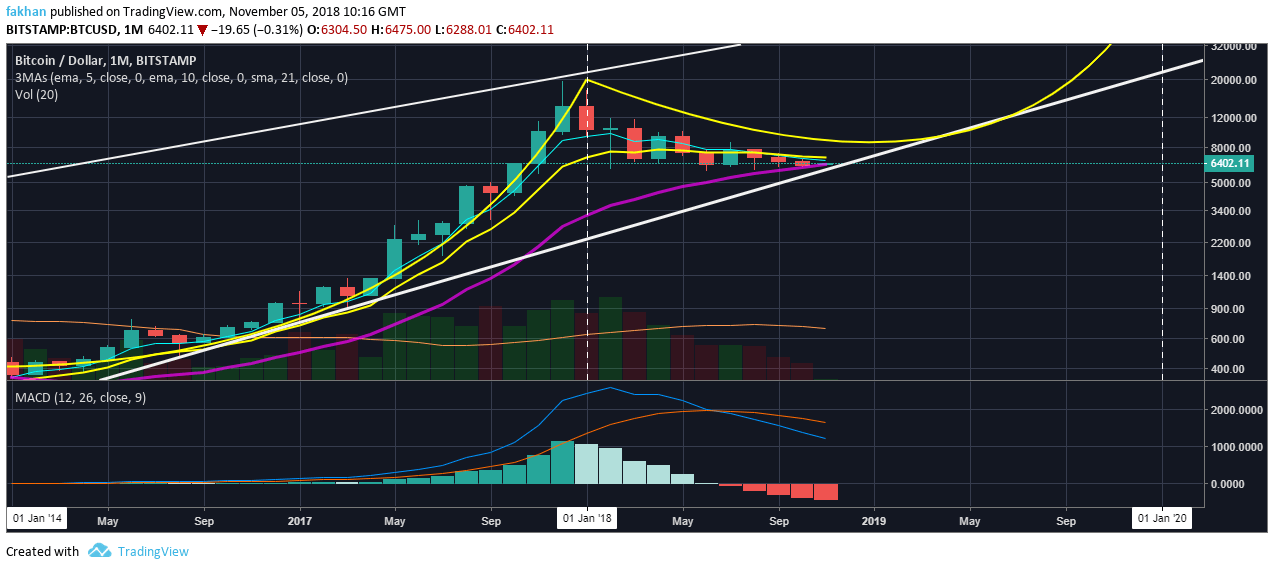
The monthly chart for BTC/USD tells a completely different story. If the price of Bitcoin (BTC) falls and closes below the 21 Month EMA, it is going to completely invalidate any bullish case. If that happens, we will see the price enter another correction in the months ahead. Interestingly enough, the 21 Month EMA coincides with Bitcoin (BTC)’s long term trend line. So, to most Bitcoin (BTC) bulls it is unlikely for this level to be broken in the first place. However, even if it does get broken, entering a short position is going to be extremely risky and the best strategy would be to wait for a trend reversal.
