


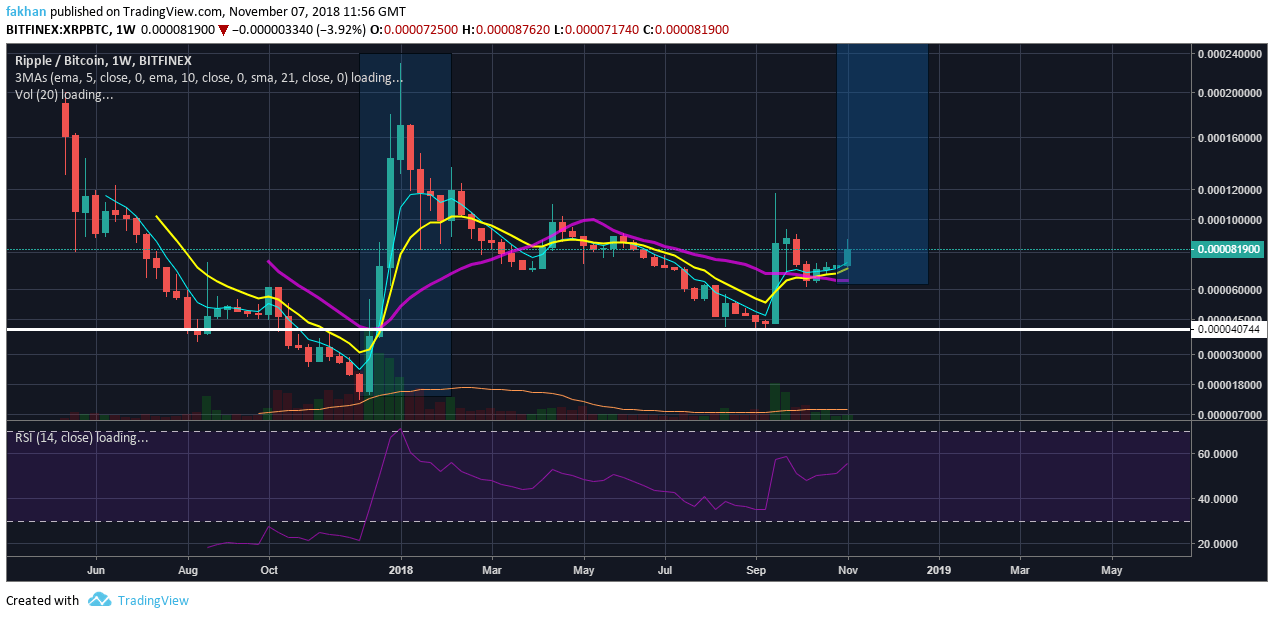
Ripple (XRP) has cleared its way against Bitcoin (BTC). The weekly chart for XRP/BTC shows that Ripple (XRP) has broken above critical EMA resistances and is now clear to take off. During Ripple (XRP)’s last cycle, we saw it forming four consecutive candles against Bitcoin (BTC) and made a new ATH. This pattern has also been repeated in the past and is very likely to be repeated again this time. If Ripple (XRP) were to form four consecutive candles this time, it is likely to break above a price of 0.00024 BTC and create a new all time high. At its current pace, Ripple (XRP) would be expected to reach that all time high around March, 2019.
All technical indicators and market conditions are ripe for Ripple (XRP) to begin a new cycle against Bitcoin (BTC). RSI for the above chart is moving towards overbought territory which will make it difficult for Ripple (XRP) to print four consecutive candles like last time. However, it is expected to reach a new all time high nevertheless even if it involves retracements along the way. In late 2017, the price immediately shot up after a red weekly candle. That last red weekly candle marked the end of the altcoin correction and the beginning of Bitcoin (BTC)’s aggressive cycle which saw both Bitcoin (BTC) and Ripple (XRP) reaching new all time highs. Those who could compare previous cycles might have easily seen the connection and capitalized on the rally. The same opportunity is available once again. Ripple (XRP) has a long tradition of repeating the past and that too very closely.
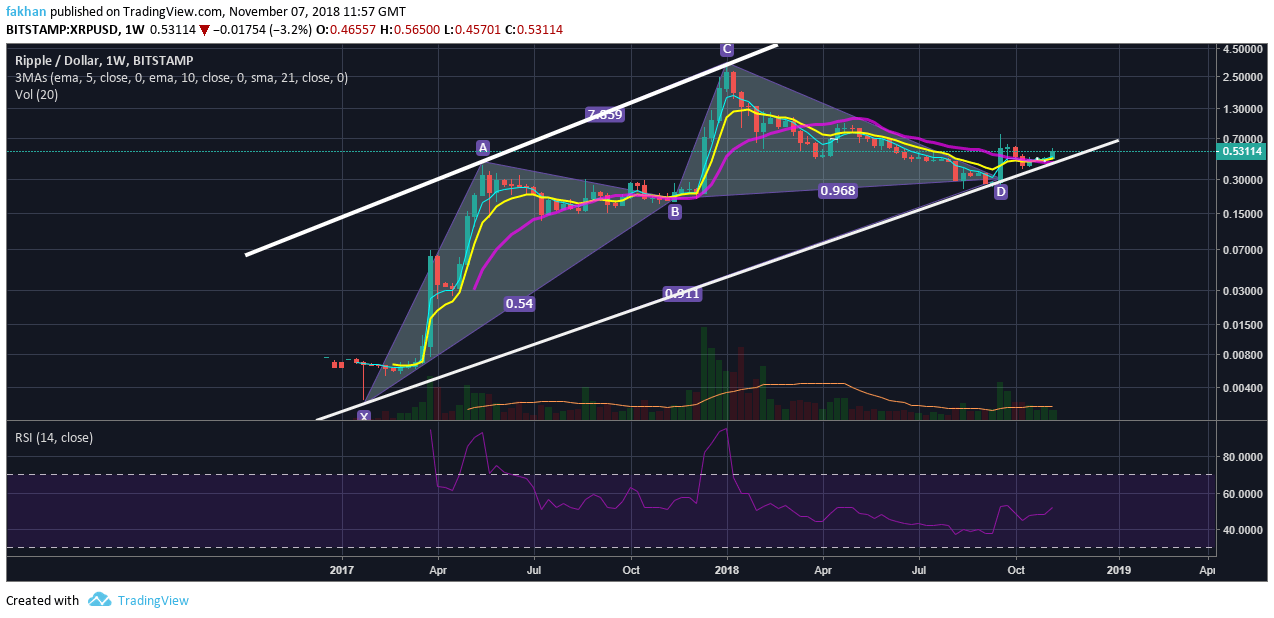
In the case of many cryptocurrencies, analysts and investors often believe that history may not repeat itself but it does rhyme. However, in the case of Ripple (XRP) history seems to repeat itself like a carbon copy. The circumstances this time are no different than the ones before when we saw previously rallies. If we look at the above XRP/USD weekly chart, we will see that Ripple (XRP) had just completed a correction in 2017 and was preparing for a rally. After the final week of capitulation, it took Ripple (XRP) almost eight full weeks to finally begin a new rally. Similarly, if we look at the current cycle, Ripple (XRP) completed its correction around September shown by the lowest level of RSI on the above chart.
When Ripple (XRP) completed its correction in September, the price shot up next week in anticipation of a trend reversal. However, it had to retrace back to the trend line as that was a false signal. Still, if we compare this to the previous cycle, we will see that Ripple (XRP) has also formed eight weekly candles just after the last week of capitulation. In addition to that, the 10 Week EMA has now crossed above the 21 Week EMA. This is a very strong indicator that Ripple (XRP) is about to begin a new cycle and is on the verge of an explosive breakout.
