


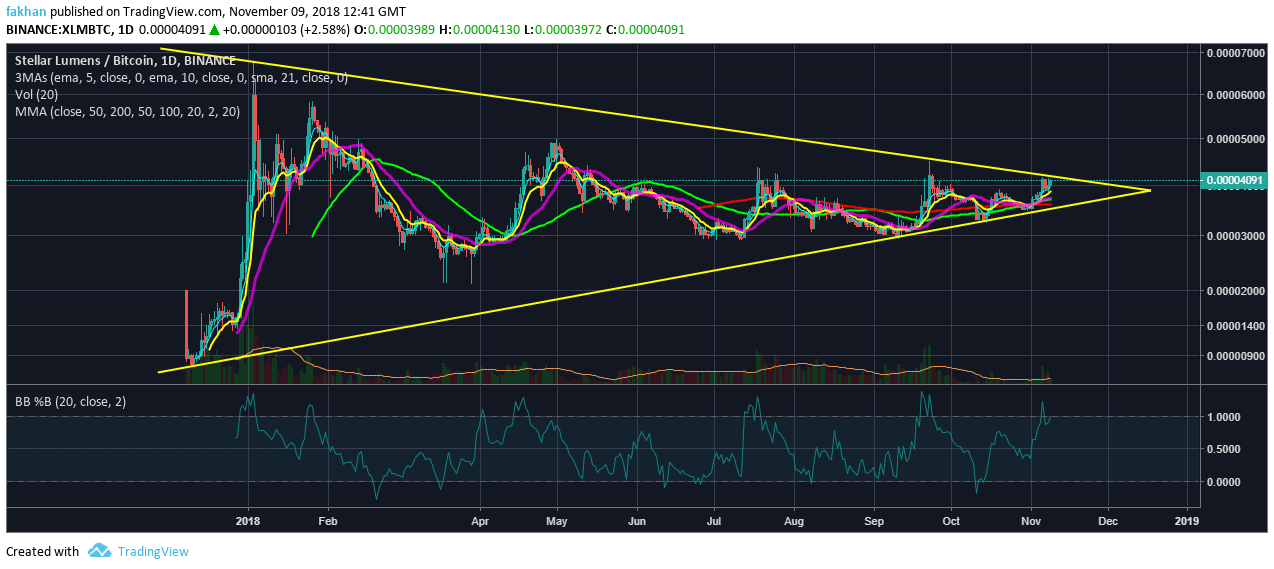
Stellar (XLM) is on the verge of its most awaited breakout against Bitcoin (BTC). The past few months had us believe that XLM/BTC had already broken out of the symmetrical triangle but that proved wrong. However, the price has been trading above its long term trend lien and has not breached it even once. Now, the question is, “Which way is Stellar most likely to break out?” Historically, we have seen that the direction the price is trading before it enters a symmetrical triangle continues to be the direction of the price when it exits that symmetrical triangle. So, looking at this chart, we can see that the price was trading up before it hit resistance and fell into the symmetrical triangle. Therefore, it is reasonable to assume that the price will break to the upside.
Stellar (XLM) has almost reached the full extent of its movement against Bitcoin (BTC) within the symmetrical triangle. There is no room for further movement. In fact, the price will have to take a decisive direction by December. Seasonality indicates that October to December is generally a bullish period of cryptocurrencies, so it is likely that we may see a breakout before then. Stellar (XLM) has seen a lot of interest during the past few months which has made it difficult for its price to slip below the $0.21 mark. Businesses as well as ICOs have shown interest not just in Stellar (XLM)’s use as a cryptocurrency but also in the Stellar blockchain. IBM seems to have done a good job at putting Stellar (XLM) in front of large corporations but it is just getting started and investors know it.
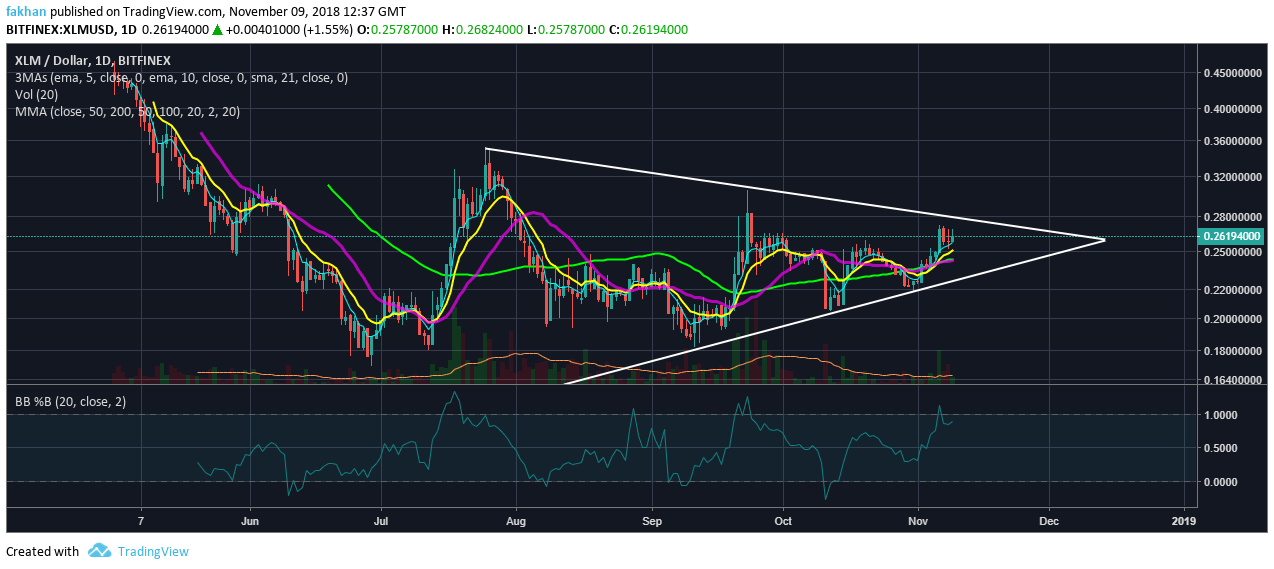
Stellar (XLM) reached a price of just over $1 during its previous bull run. If the market continues the same trajectory and Stellar (XLM) continues to have a strong use case, XLM/USD is likely to cross the $2 mark during its next bullish cycle. Stellar (XLM) has also reached the full extent of its correction against the US Dollar (USD) and is now at a point of a trend reversal. The EMA alignment is also in favor of Stellar (XLM) bulls at this point. The 10 Day EMA has already crossed above the 21 Day EMA and the price is currently trading above both. The price is trading in a similar symmetrical triangle as in the case of XLM/BTC. If the price were to break out of this symmetrical triangle, it would trigger a lot of buy orders and the price can be expected to rally a lot faster than expected.
Stellar (XLM) has room till December to remain inside the symmetrical triangle while trading against USD. The price is not likely to drop below the 10 Day EMA but it is also not likely to break out of the triangle at this time either. It has become a lot easier to turn the tables at this point, but there are no bulls at sight. The bears are running scared on most exchanges and we have already seen a massive drop in the number of shorts. Whether or not the price breaks to the upside remains to be seen, but regardless of its direction the breakout will be decisive and will likely determine the direction of Stellar (XLM) for months to come.


