


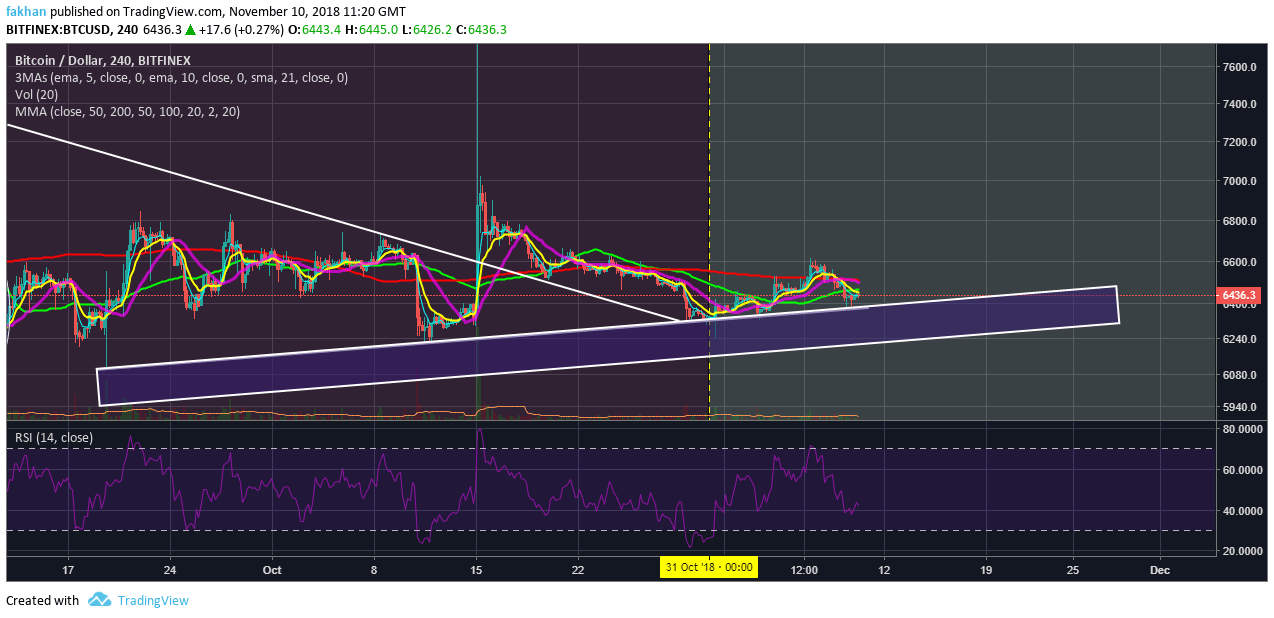
Bitcoin (BTC) began a new cycle on its birthday. If you look at the BTC/USD 4H chart above, you can see for yourself how Bitcoin (BTC) completed its correction on 31st October, 2018 and began a new cycle. This is not the first time Bitcoin (BTC) has completed a correction in this manner. In 2014, Bitcoin (BTC) completed its correction cycle the same way, by first breaking above the triangle and then correction above it. We will analyze that in detail by comparing the two charts later in this analysis. Let us first understand the significance of two numbers, “10” and “2018”. Was it a coincidence that Bitcoin (BTC) just completed its correction on 31/10/2018? To answer that question, we will first have to see where the numbers “10” and “2018” actually came from.
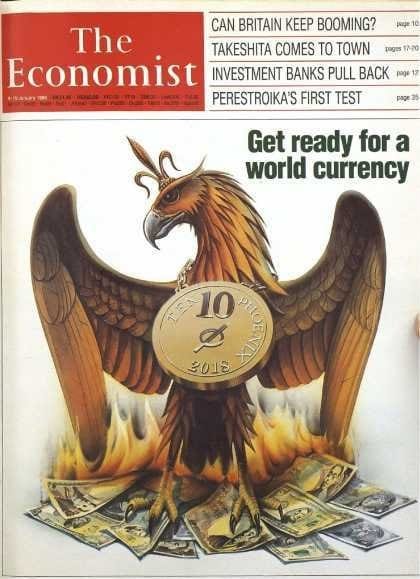
Source: Economist; 01/9/88, Vol. 306, pp 9–10
In September 1988, the Economist featured a cover photo on its magazine with the title, “Get ready for a world currency”. The article in the magazine on this subject had the title, “One world, one money”. You can read the full article here. The cover photo features a phoenix rising from burning dollar bills. The phoenix is wearing a coin shaped pendant with the numbers “10” and “2018” on it. This was in 1988, way before the financial crisis of 2008. On October 31, 2008 Bitcoin (BTC) was officially born. Coming back to the numbers, “10” and “2018”, let us examine what they could mean. “2018” clearly means the year “2018” so no doubts there. “10” could generally mean the month of October but when put together with 2018, it could also mean the “10th Birthday” of Bitcoin (BTC) which falls on 31/10/2018. So, what really is the significance of all this?
Those who follow history, politics and economics for long know how closely related all three are on a macro scale. There is so much more besides the charts that an average person may not be able to figure out. However, if you look at the charts in the context of history, politics and economics, everything lines up. Throughout history, most of these events have been pre planned by a small but powerful minority. However, with Bitcoin (BTC) things are different. It is supposed to be decentralized. So, when Satoshi Nakamoto wrote the whitepaper, he/she/they sent it to certain private mailboxes. With something like Bitcoin (BTC) messaging/signaling has to be done in this way because apparently there is no organized way for controlling certain events on a macro scale.
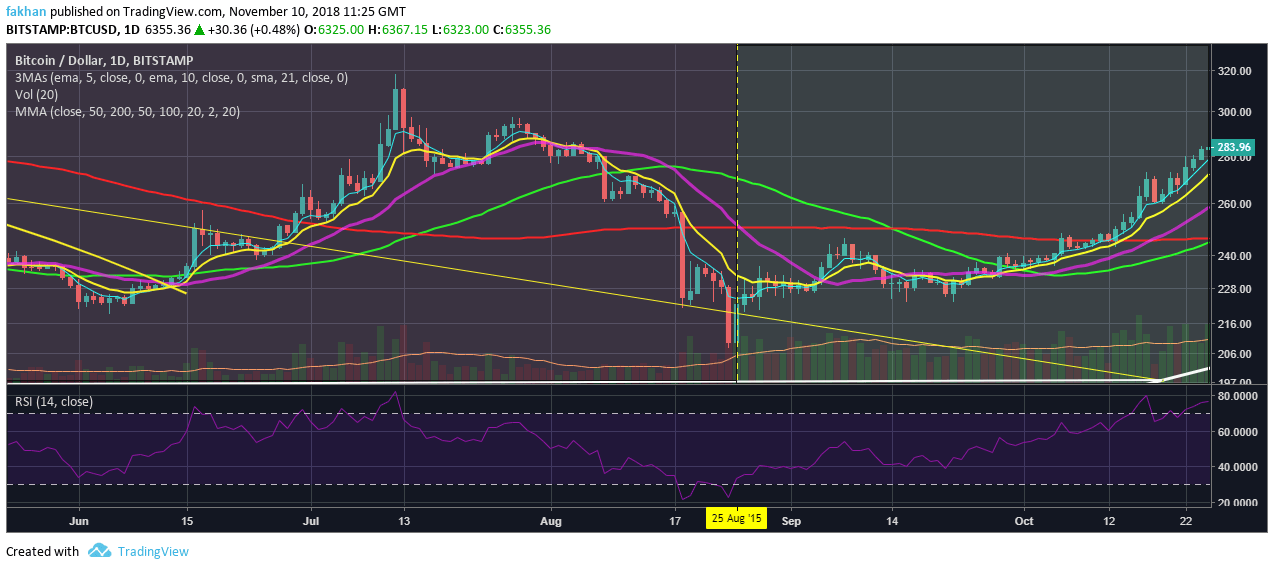
Considering that we are on the brink of an unprecedented financial crisis, it is only reasonable to assume that the article published in the Economist in 1988 with the numbers “10” and “2018” is trying to make a point that this might be the time we actually see “one world, one money” come to fruition. The signaling through the words “10” and “2018” is of immense significance. If we get an ETF or institutional adoption through Baakt by the end of the year, it would explain why 2018 was supposed to be an important year. Before we conclude this discussion, I’d like to draw your attention to the above BTC/USD daily chart for 2015. You can clearly see how the price did the exact same thing it is doing now. It pierced through the downtrend resistance and left the triangle, then corrected above it before beginning a new cycle. I’ll leave it to you to closely compare the charts in this analysis to see for yourself how closely they resemble one another.


