


Although the uranium sector was not part of our 5 Must-See Commodities Charts for 2019 it certainly qualifies as one commodity sector to watch very closely for the weeks and months to come. Not only suggests our inflation forecast for 2019 that a new inflation cycle may be starting but we also see momentum building up in leading uranium stocks. Cameco Corp is the bellwether stock in the uranium sector, and its chart starts look very juicy.
We wrote about the uranium sector recently in this article: 3 Must-See Charts Show Bullish Momentum Brewing In Uranium Stocks. Moreover, we also published our Fission Uranium Stock Forecast 2019 with a bullish forecast for this uranium explorer.
Inflation trend supporting the uranium sector
When it comes to our inflation expectations which might be supporting the whole commodities sector we wrote this very recently:
The gold price and the inflation indicator have a relatively strong positive correlation on their high level direction. Primarily secular double bottoms and double tops seem to be a reliable indicator and ‘catalyst’ for precious metals prices, in both directions. After inflation’s giant double bottom of 1999/2001 and giant double top of 2008/2010, it might be setting up for a giant double bottom in 2016/2018!
The inflation chart we published in our inflation forecast mentioned in the intro shows the major double bottom in 1999/2001 (with a higher low) and the major double top in 2008/2010 (with a major lower high). In a somehow similar fashion the 2016 major bottom may be a higher low against the 2018 bottom.
One of the winners in this space might be the uranium sector, next to the precious metals sector.
Note, though, that not all commodities might do well simultaneously. There might be short to medium term bull markets, in an alternating fashion.
Cameco: bellwether uranium stock gains momentum
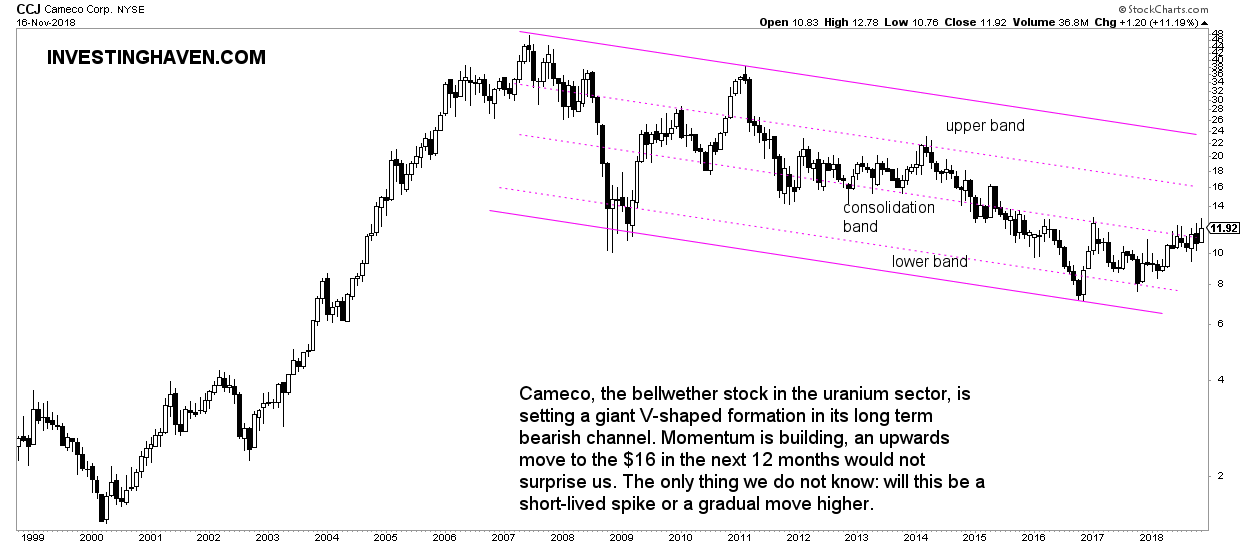
The uranium sector, represented by its bellwether stock Cameco, symbol CCJ, makes the point.
Its long term chart shows a giant V-shaped formation within its bearish channel. The point about longer term investments is to buy low and hold until a spike high. Buying low suggests buying when literally nobody talks about it. As said before news is a lagging indicator, so the fact that it is extremely quiet in terms of headlines about uranium is a good thing, for sure when combined with a great chart setup.
The opposite is true as well: when everyone becomes bullish, and there is a continuous stream of uranium related headlines, it will be time to sell.
Right now the uranium sector is still in its long term bear market, one that arguably started in 2011. The chart below makes the point. The bear market channel has a couple of areas, or bands. Cameco is clearly moving higher from its lowest bands. That’s a bullish evolution.
With a clearly rising uranium spot price it seems that there is serious upside potential among uranium stocks, first and foremost Cameco. We expect a test of the $16 level according to the chart where it will meet strong resistance. Best case the $24 level might be tested provided the uranium spot price continues to rise.
TOP CRYPTOCURRENCIES TO BUY: InvestingHaven’s top crypto tips are in a “buy zone”. Top notch guidance on how to play the grand bull market in crypto from InvestingHaven’s research team, only for $2 per week. Crypto & Blockchain investing service >>
