


Bitcoin price (BTC/USD) had a dire week, breaking down last Wednesday from its 2018 consolidation reaching weekly lows of $5200.
This week started no better with new lows being found after a further selloff at around $5050. Here we take a look at some of the immediate levels trades and investors alike worth paying attention to.
Bitcoin Price: Daily Chart
Bitcoin‘s resilience sustaining prices around $5500, gave up on Monday as the wider trading environment kicked off the week, with markets pushing BTC price 00 down to test $5000.
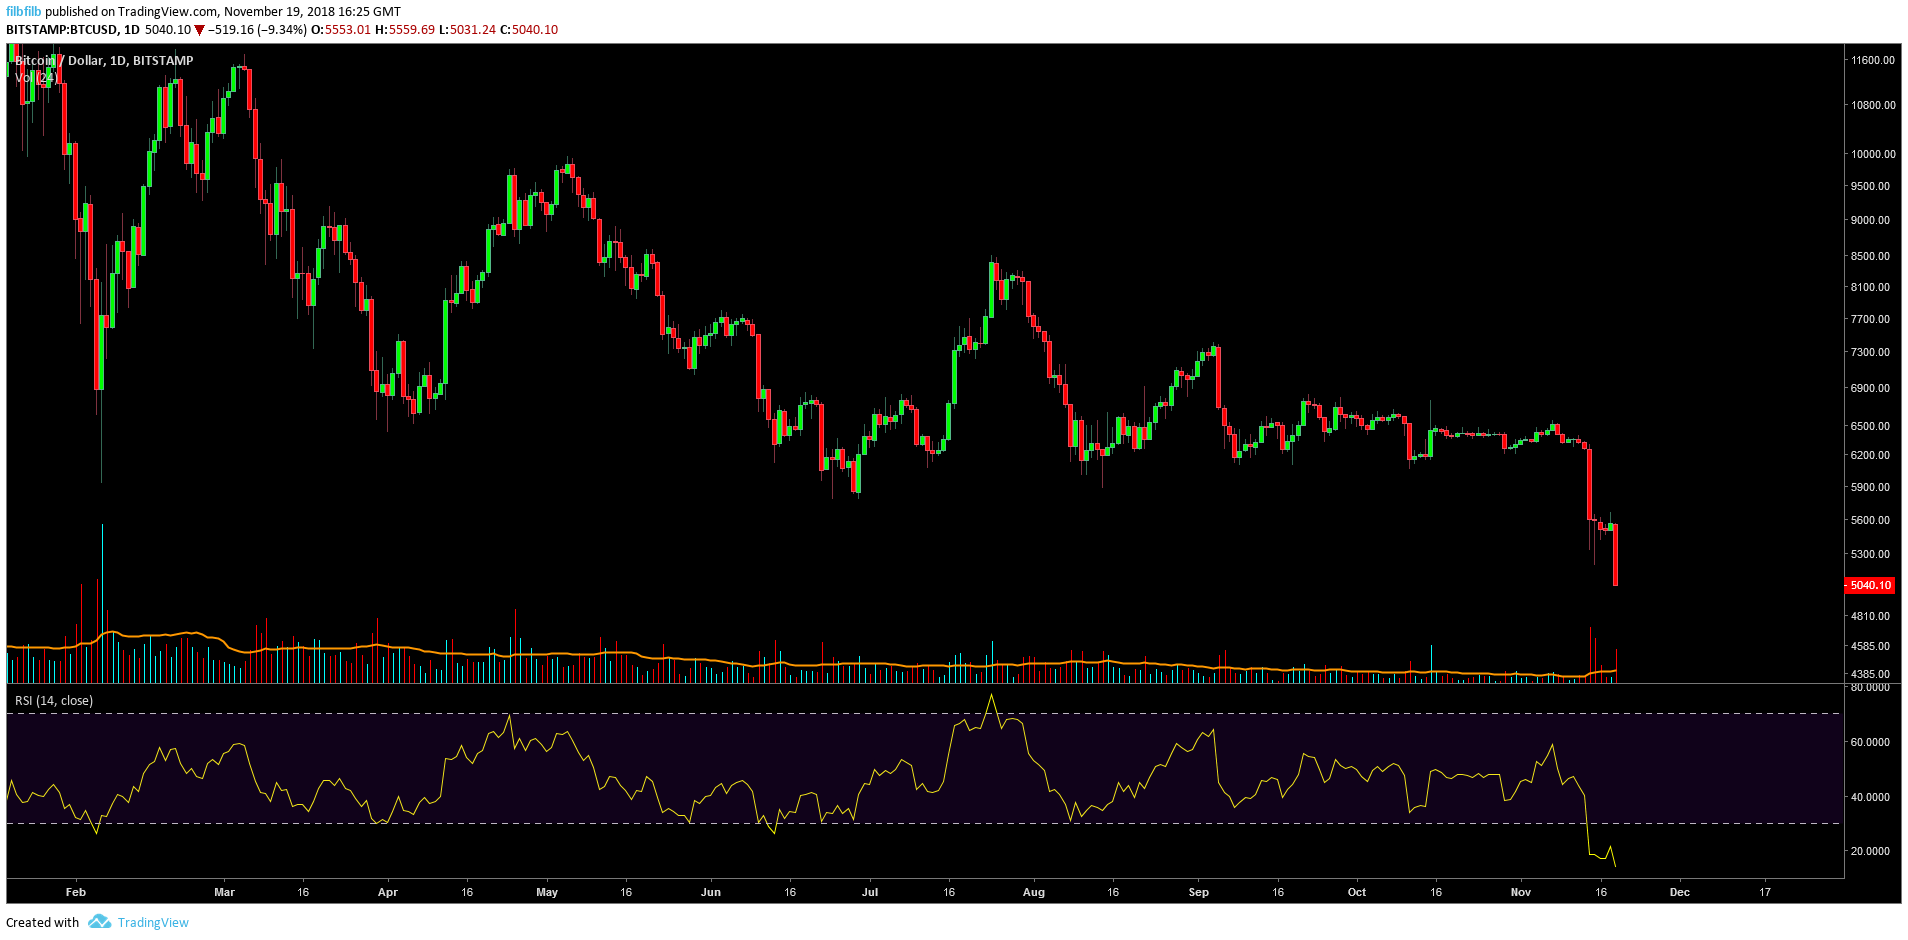
As the market attempts to adjust to the breakdown, many are trying to work out where the bottom may be. Here we look at a few of the scenarios being contemplated by investors and traders alike.
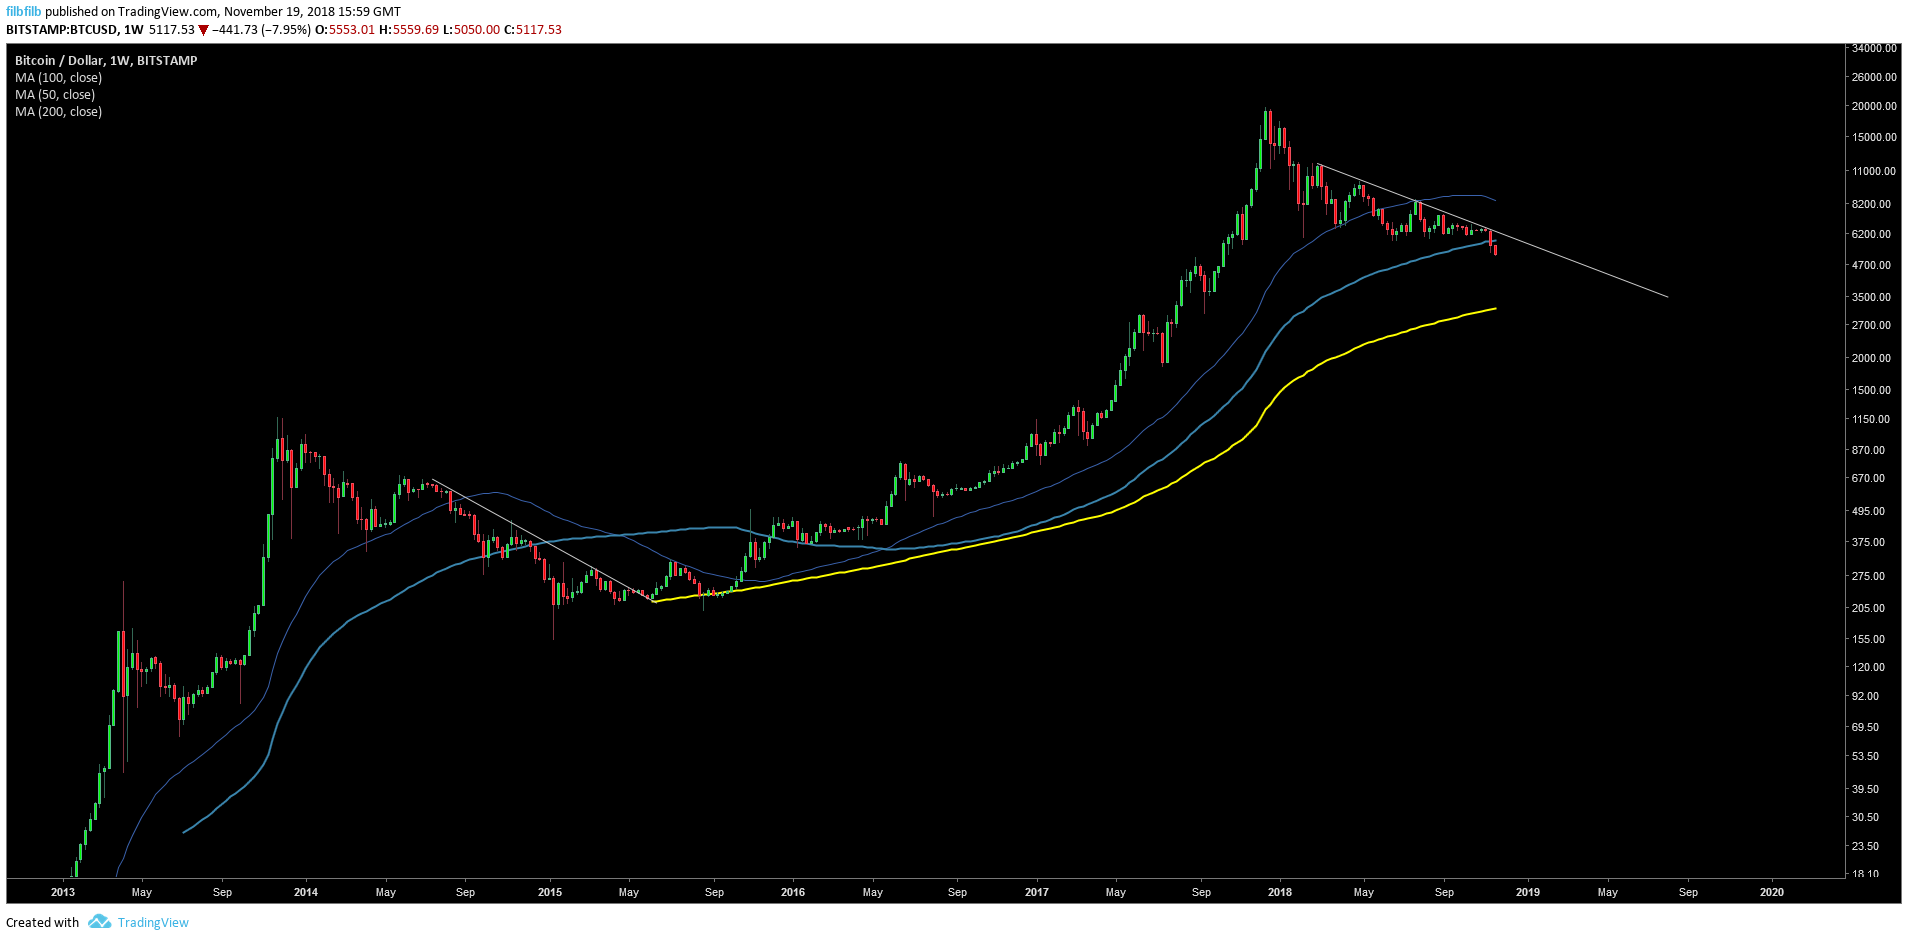
Weekly Chart
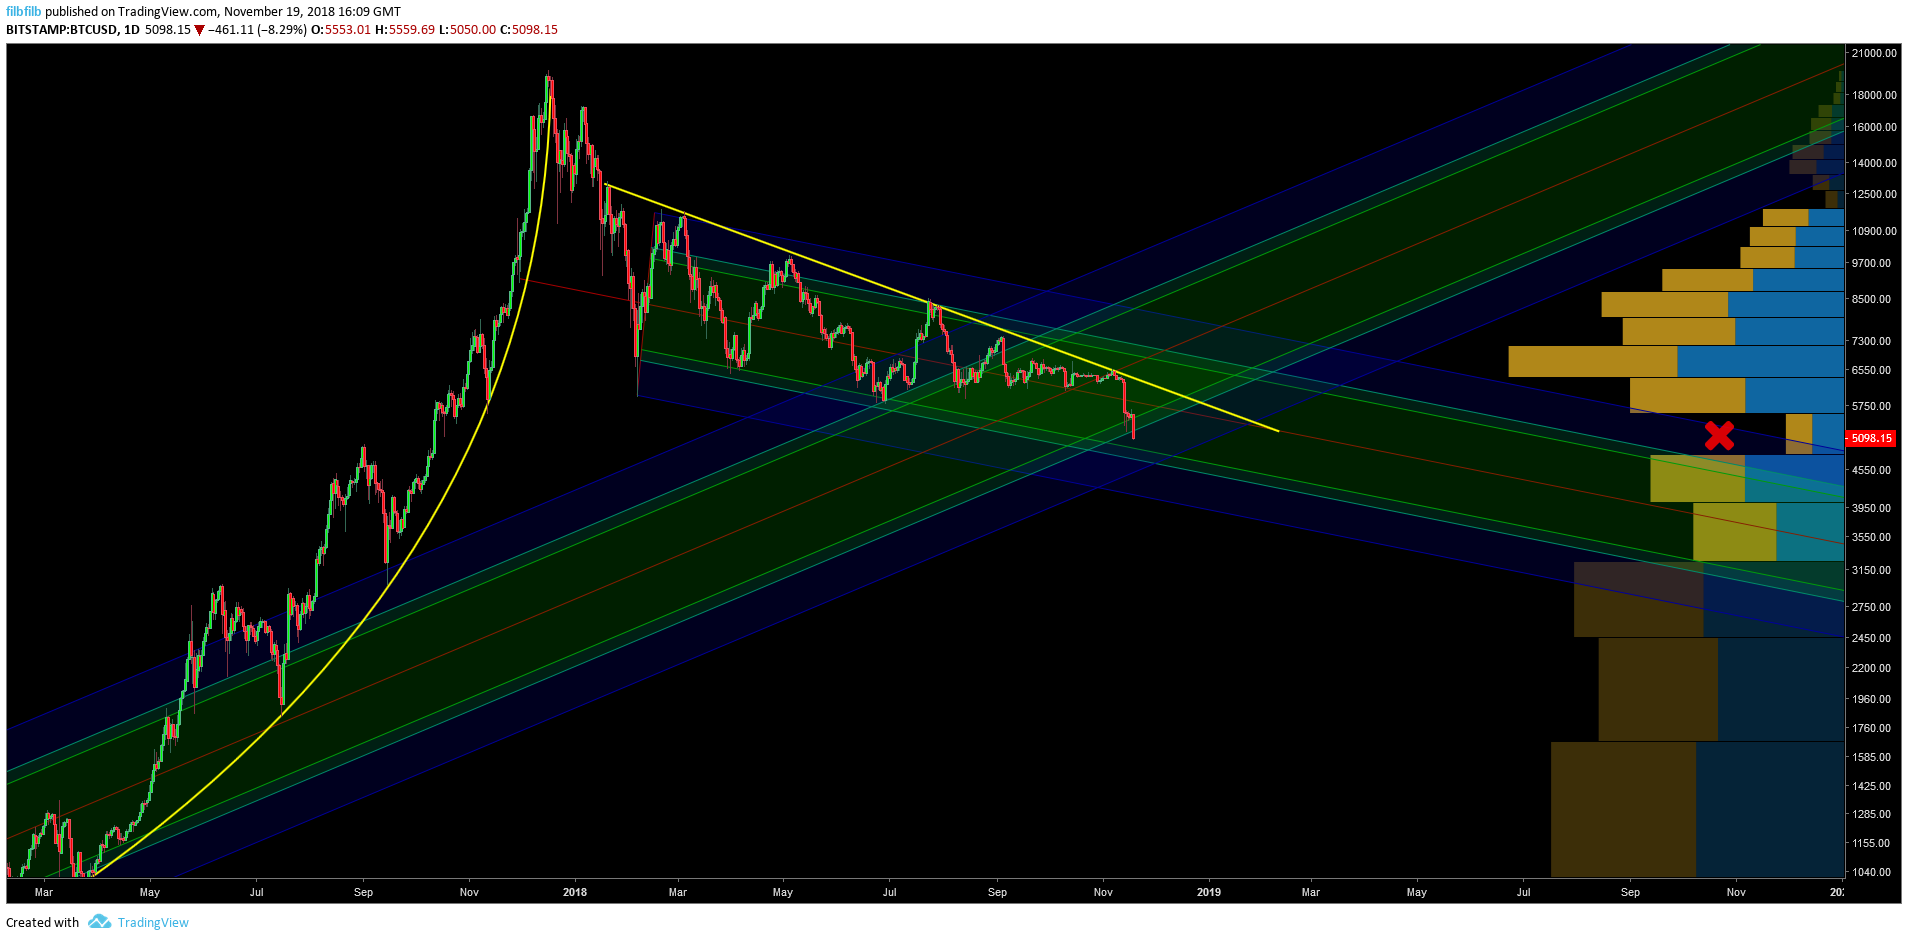
The lows of August – 2015 August 2017 uptrend converges with the lows of the 2018 downtrend around $4400-4800. There is a distinct lack of historically traded volume between $4800 and $5500, which may explain why the market is currently falling through the current price range with minimal resistance.
Traders may look to this price range for a bounce, marking a 75% discount from December 2017 prices and a psychological level for both buyers and short covering.
A break and close above previous support at $6,100 would signify some confirmation of a longer term bottom.
2015 Bottom
The 2015 bottom was found at the top of the 2012-2013 trend. If the same is applied to 2019 it again suggests $4800 region may be a significant level of support.
The most bullish scenario that can be presented is that this down move is being induced by a large player tempting sell volume to the market, which was lacking around $6,000, in an attempt to make a large, longer-term buy and hold position.
This kind of trading is known as a fake out trap to run stops and create liquidity to build such a large opposing position, but it really the only hope short-term players have in this market resuming an uptrend.
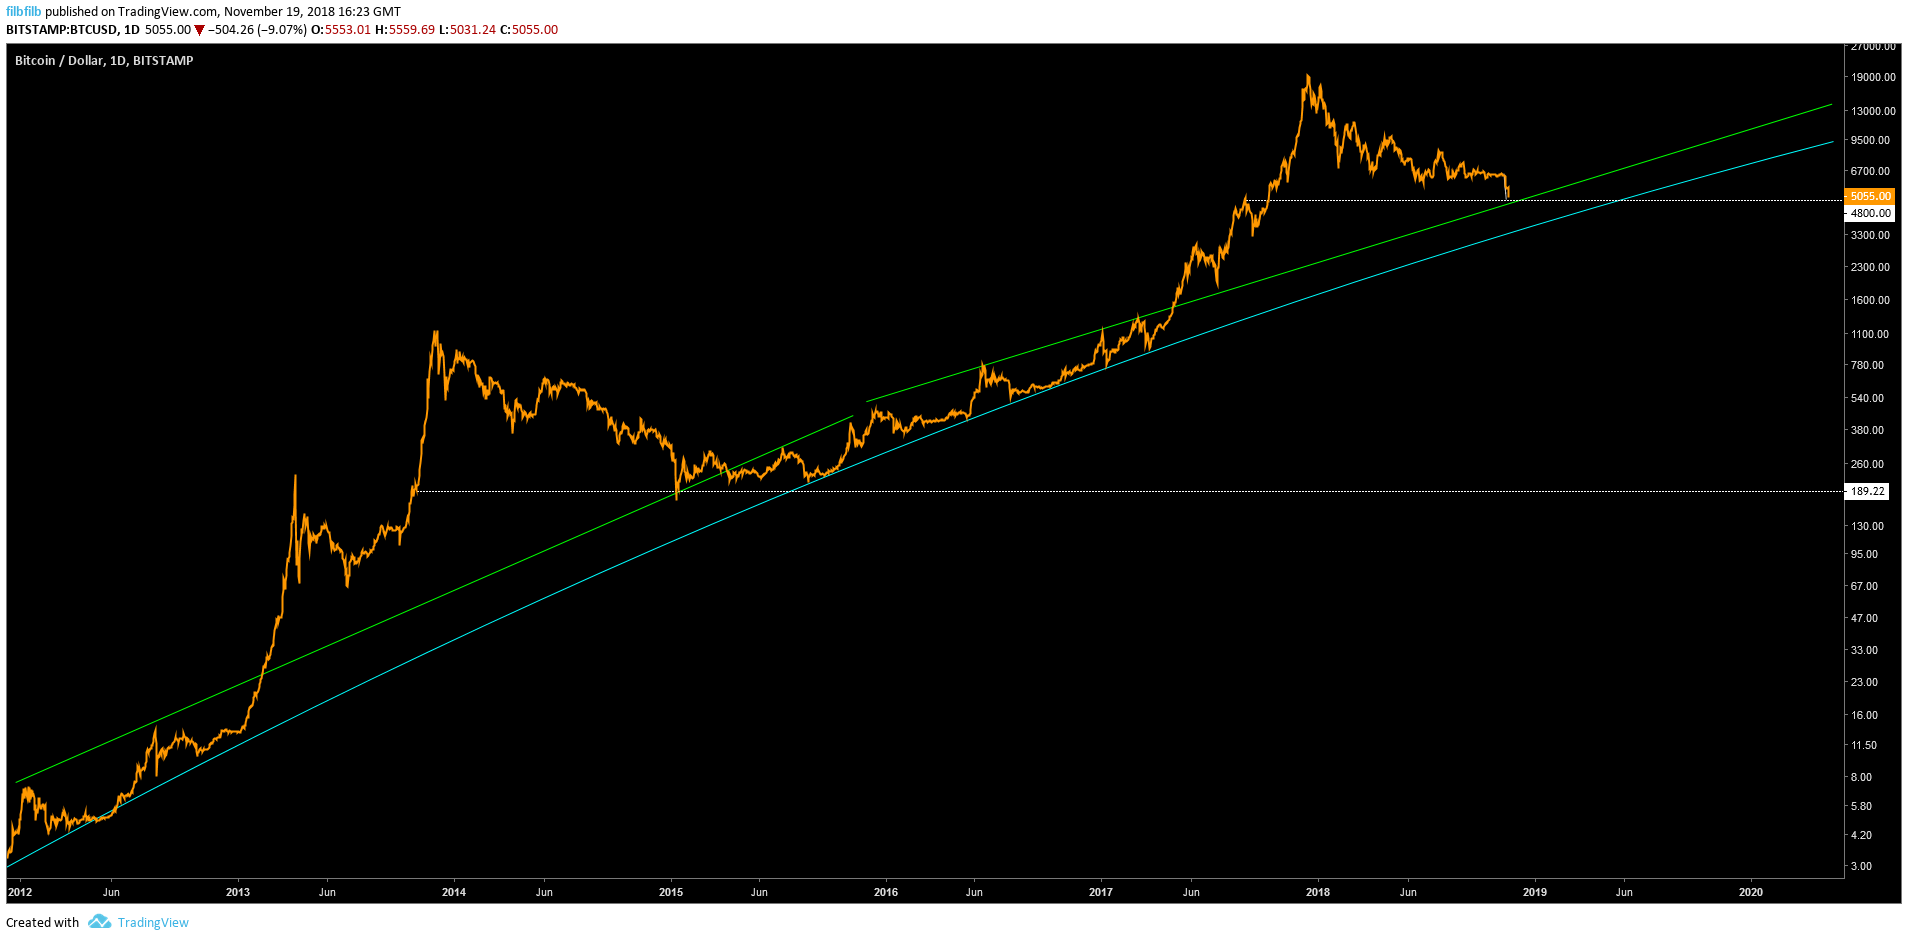
$3k – A Comparison to 2015
Looking at 2015 the bottom was found resting alongside the 200MA, currently trending towards $3200, which is where the bottom of the volume range currently resides.
This level is where the market last witnessed significant volume, bouncing the market back to $4350 within two weeks.
It is likely that a number of market participants who took profits from above this level, or from those that sold here historically and had to endure the run up to 20k will happily re-enter the market on an 85% retracement
Bitcoin Cash Hashing War
Hashing power has been diverted from the BTC network to provide support to the Bitcoin Cash ‘hash war,’ which goes some way to undermine the network security for Bitcoin.
Game theory in Economics and as applied here, works on the basis that individuals are incentivized with their resources to do what is best for themselves and the group, which in this case would be to mine the more profitable Bitcoin chain, however, there is currently an uneconomical war being conducted meaning that the marginal profitability from mining is being ignored in the quest for dominance over the BCH network.
It’s unclear how this war of attrition using SHA 256 resources is directly impacting Bitcoin price 00, but it would be reasonable to assume that it is not positive to the outsiders looking in and until there is liquidity to dump the opposing chains coins, they will need to use their Bitcoin to provide working capital to cover the marginal cost of production.
The probable outcome is that the losing miners will revert their hash and capital back to the BTC network once a winner has been found.
In Summary, Bitcoin 00 looks likely to continue its downward momentum from here, testing the low volume price ranges, with the closest one closing around $4800, however, the strength of the hands of the Hodlers will be tested.
A large engulfing candle supported by significant volume is the only thing which the bulls want to order from the menu, but where that will occur remains to be seen.
Does Bitcoin price suggest it is now a buyers market? Where is the bottom? Let us know your thoughts in the comments below.
[Disclaimer: The views expressed in this article are the personal opinion of the author and do not reflect the views of Bitcoinist. The information in the article should not be taken as financial advice.]
To get receive updates for the writer you can follow on Twitter (@filbfilb) and TradingView. Images courtesy of Tradingview, Shutterstock.
