


Bitcoin prices are experiencing headwinds and continue to drive down the entire crypto market. Prices are breaking down further on Monday as November continues to be one of the worst months for cryptocurrency prices. Readers are asking questions about InvestingHaven’s crypto forecasts. Think of the 5 Must-Read Cryptocurrency Predictions for 2019, the Bitcoin price forecast 2019 as well as the Ripple’s price forecast for 2019.
Note that the increased volatility is good for trader’s but less positive for those who buy and hold as a trading strategy. After rallying 21% in July, which gave some hope that prices had found a bottom, bitcoin has tumbled 9.2% in August, 5.8% in September, 4.5% in October and is currently down 17.2% in November.
Why Are Cryptocurrency Prices Dropping in November 2018?
The crypto market is based on supply and demand. Crypto additionally is a representation of how riskier assets are performing. Riskier assets have come under pressure in October and November and this phenomenon has played out in the cryptocurrency markets. Last December, the Chicago Board of Options Exchange and the Chicago Mercantile Exchange introduced futures which provided traders with a way to speculate that the price would move lower. Currently, there are several contracts for differences that help traders speculate that the price of bitcoin will decline. With 2-way flow available, prices could have further room to drop.
[UPDATE on November 21st 2018: crypto prices continued to fall, and Bitcion eventually dipped around $4200 only to stabilize around $4500 which is now considered critical support.]
What’s Next for Cryptocurrency Prices After November 2018?
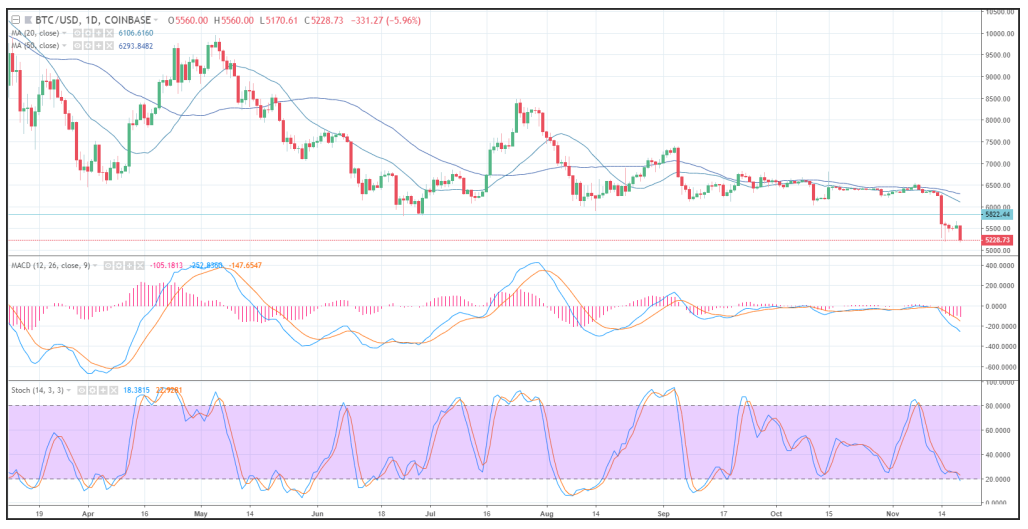
This classic technical analysis, which describes future price action, are mixed. Bitcoin, which is the most liquid of the cryptocurrencies, is trading under pressure and could test lower levels. Momentum as reflected by the MACD (moving average convergence divergence) index is negative. The MACD histogram is printing in the red with a downward sloping trajectory which points to accelerating negative momentum and possibly lower prices. Daily price action shows that bitcoin has broken through support levels and is testing the November lows.
The one caveat is that prices on a short-term basis are oversold. The fast stochastic, which is a momentum oscillator, is printing a reading of 18. This is below the oversold trigger level of 20 and could foreshadow a correction.
You can find out more about the technical indicators you can use to evaluate the bitcoin market using the iFOREX review.
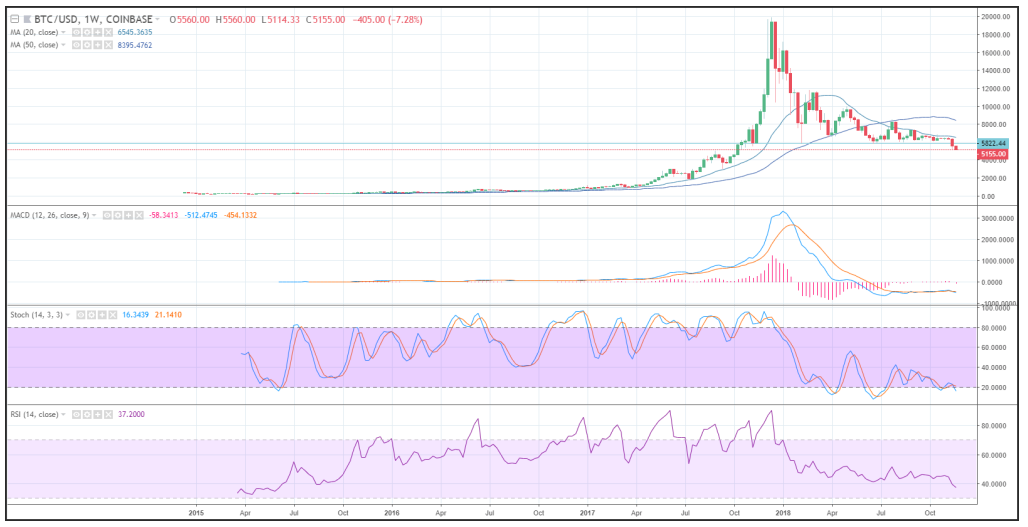
The weekly chart of bitcoin is also showing that prices are also breaking down. The next level of target support for Bitcoin is seen near the July 2017 lows at 2,975. Weekly momentum has turned negative as the MACD generated a crossover sell signal. This occurs as the MACD line (the 12-week moving average minus the 26-week moving average) crosses below the MACD signal line (the 9-week moving average of the MACD line). The MACD histogram is printing the red with a downward sloping trajectory which points to lower prices.
Like the daily chart, the fast stochastic is also printing in oversold territory. The current reading of 16, points to a potential reversal. The relative strength index (RSI) which is also a momentum oscillator declined with price action. This reflects accelerating negative momentum. The current reading of 37, on the RSI is above the oversold trigger level of 30 and still has room before weekly bitcoin prices can be considered ‘oversold’.
TOP CRYPTOCURRENCIES TO BUY: Which top crypto tips are flashing a BUY signal now? Which to avoid? Top notch guidance on how to play the grand bull market in crypto from InvestingHaven’s research team, only for $2 per week. Crypto & Blockchain investing service >>
