


Stock market indicators in the U.S. are deteriorating. Is there a stock market crash in 2019 underway? After our Global Market Crash In 2019 piece we now look at 12 charts which are, similarly, diverging: some indicators in bearish territory and some not (yet) in bearish shape.
The stock market is on pace for its worst December since the Great Depression says CNBC. Whether we’ll have a stock market crash in 2019 or not remains to be seen. As a reference, though, this is not a great setup certainly knowing that the worst December was in 1931 at the panic stages of the Great Depression stock market crash!
The Dow and S&P 500 closed Monday down 7.6 percent and 7.8 percent this month, respectively.
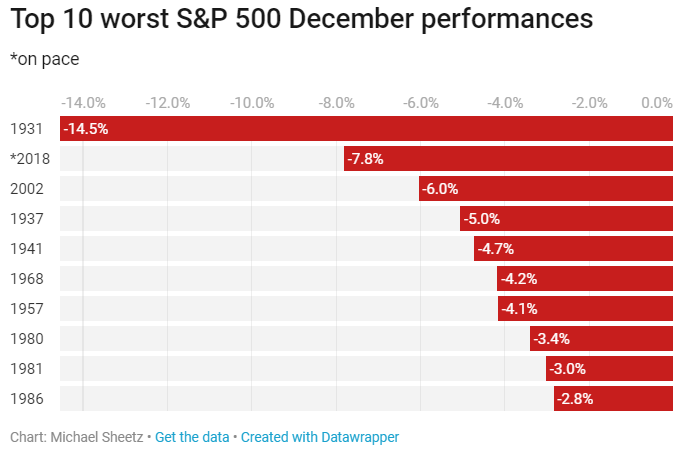
December is typically a very positive month for markets. The Dow has only fallen during 25 Decembers going back to 1931. The S&P 500 averages a 1.6 percent gain for December, making it typically the best month for the market, according to the Stock Trader’s Almanac.
So is this a precursor for a stock market crash in 2019?
Not that fast, there is more data we need to look into, primarily (leading) indicators for the stock market. We see a couple of bearish indicators and some that are not-that-bearish at this point in time.
Stock market crash 2019: Bearish indicators
Stock market crash in 2019 indicator #1
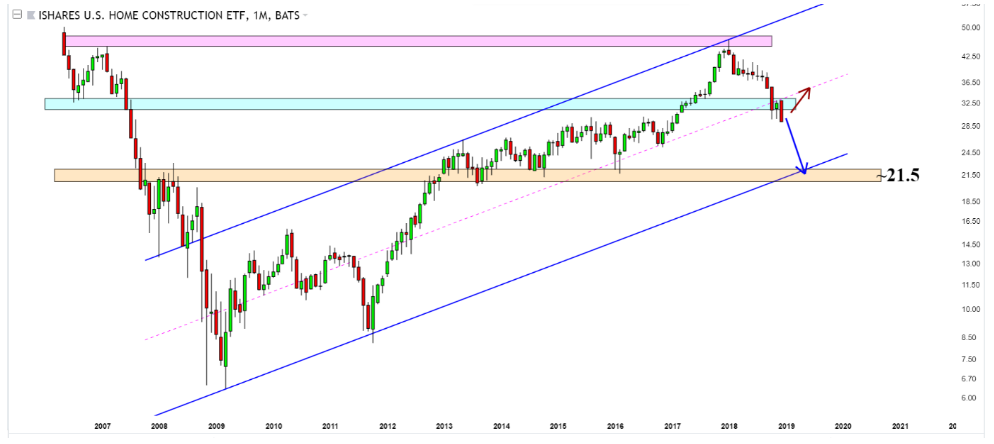
Almost 11 months ago we were nervous about a crack in the equities market using the correlation of the ITB ETF with the Home Construction ETF chart, as readers can see in this article.
In updating the chart it is clear that the initial target was spot-on where price lingered for a few weeks at the median line. However, support broke. If the home construction price continues to drop further to ~21.5 (orange band which is an important dual horizontal and channel support) it will be first evidence that equities market could indeed decline further.
Downward momentum has a larger probability than a surprise rebound according to us.
Stock market crash in 2019 indicator #2
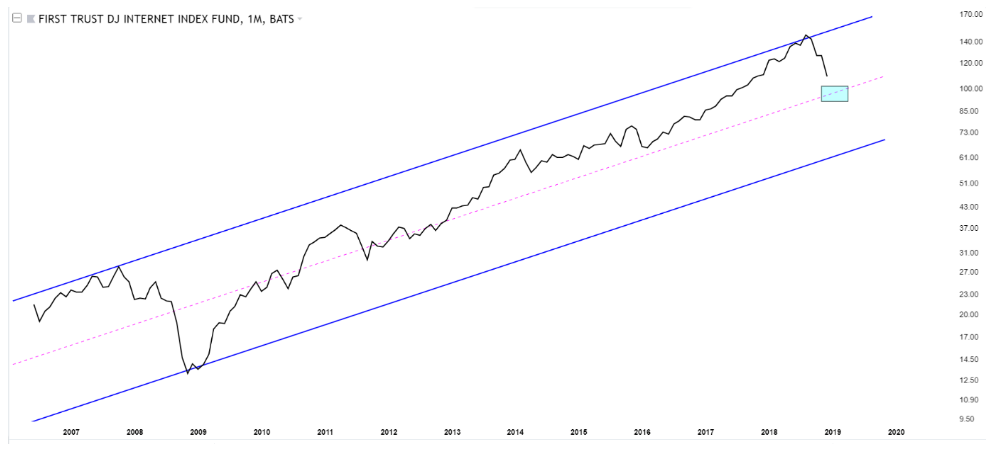
Early August we started to get concerned again 2 months ahead of the October crash when we had the First Trust DJ Internet index (FDN) chart screaming of another more severe crack compared to the one in February. What happened after requires no comment.
The internet stock index went higher and higher while we told our premium members to unload technologies stocks rather than buying more.
Tech stocks could lead the market to go down even further. The median line of monthly FDN chart will be a temporary resting place around 95 – 100, failure to hold could see price roll all the way to channel support.
Stock market crash in 2019 indicator #3
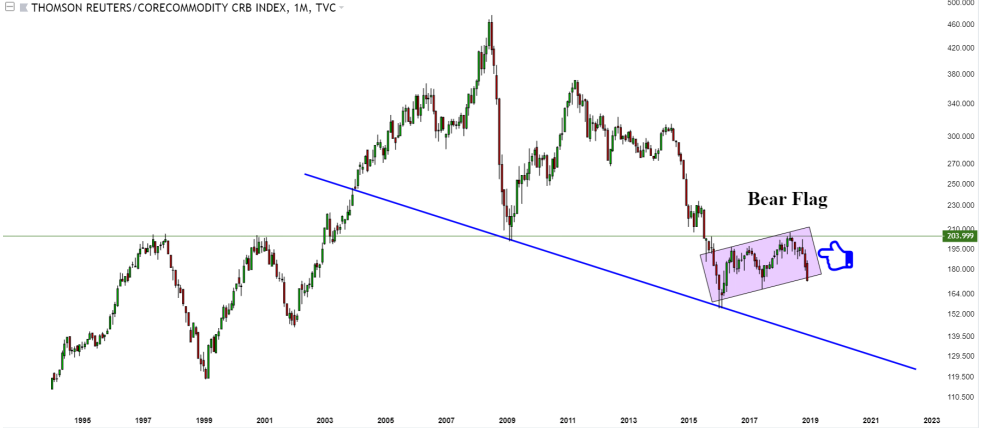
Third, the commodities index CRB signaled a warning when price failed to break above the do-or-die psychological resistance level of 204-205. Not only did it get rejected price now looks poised to break below the bear flag.
Stock market crash in 2019 indicator #4
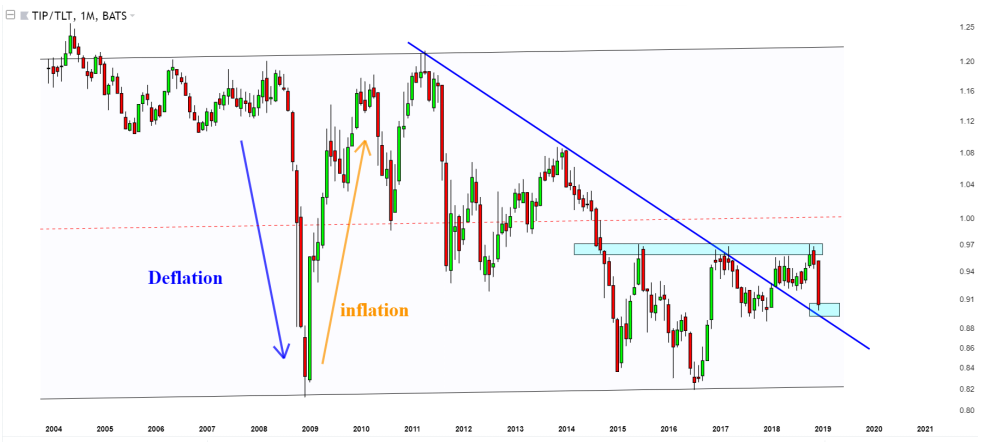
Fourth, the TIP/TLT ratio which we consider an inflation/deflation indicator has exerted a deflationary or non-economical growth scenario. Its chart has now a last line of defense at the blue downtrend line. Any break below the current area could be bearish for the global economy.
Stock market crash in 2019 indicator #5
Fifth, more evidence can be found from the monthly chart of HYG which shows that price broke down of an uptrend line support (although the December candle is not completed yet).
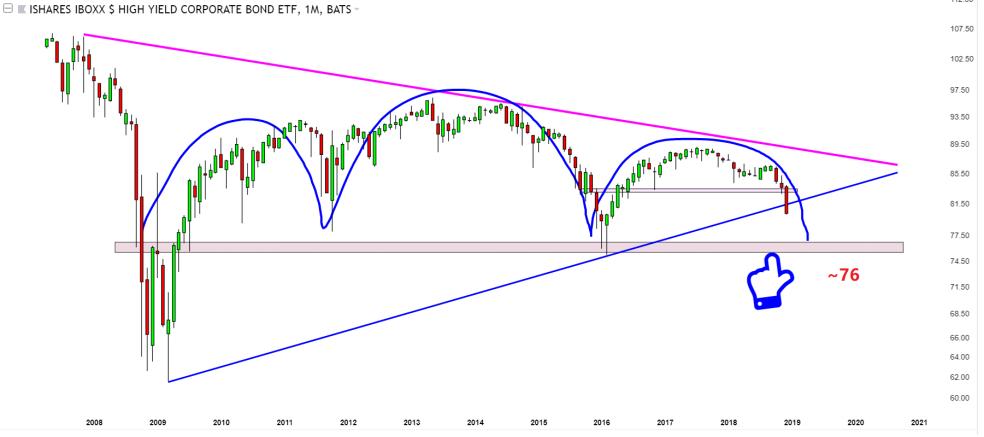
What would be alarming is any break below the 76 support zone in the above chart.
Stock market crash in 2019 indicator #6
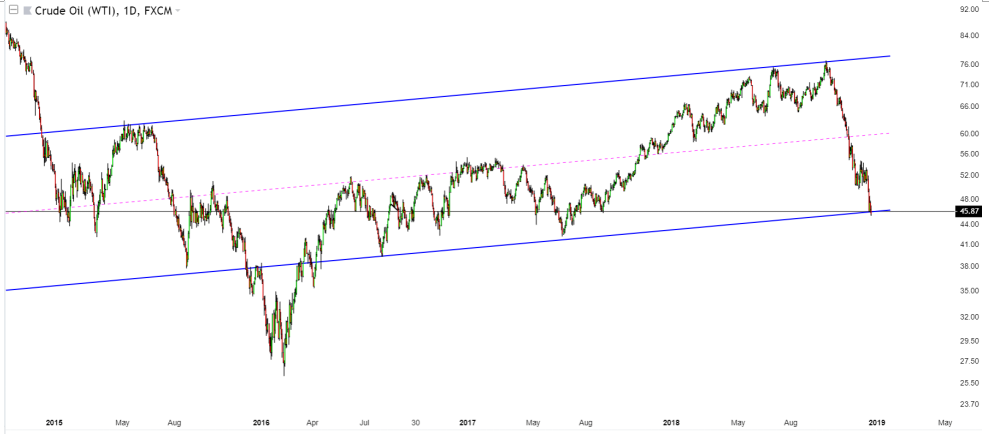
Sixth, the daily crude oil chart shows a dual support at stake. Failure to hold will send stock market nosedive much quicker or lower down.
Stock market crash 2019: Neutral indicators
On the other hand the following 4 indicator still have a not-so-bad setup.
Neutral indicator #1
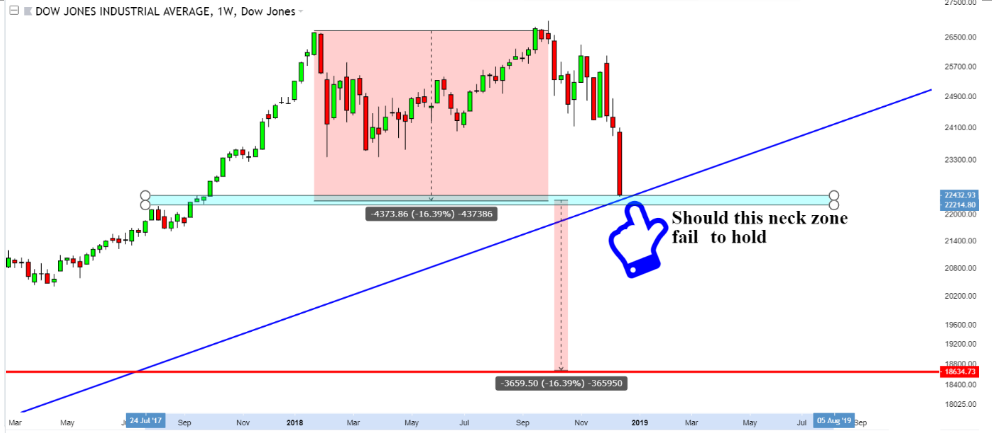
The Dow Jones Industrial Index DJI is at almost near to the uptrend line from the 2008 recovery. As long as no major breakdown of the uptrend line, there is still a bullish fighting case as for one more quarter.
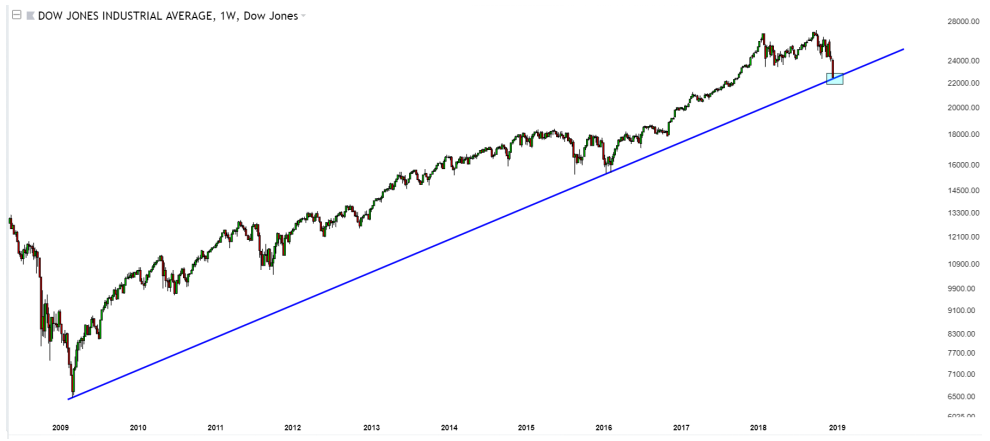
The blue zone 22214 – 22432 plays an extremely crucial role of future direction of DJI. Break this zone and we are likely to see DJI accelerate down to ~ 18634, which is about 3500 points further down.
Neutral indicator #2
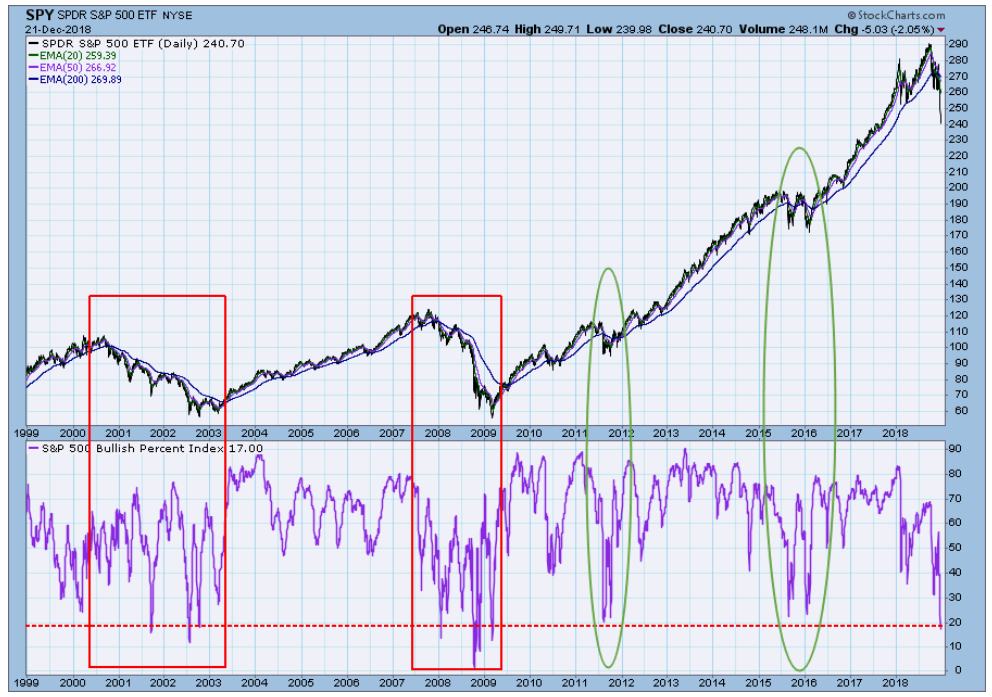
Courtesy of Carl Swenlin’s chart the S&P 500 bullish percentage has hit the previous oversold zone which could signal a rebound soon.
Neutral indicator #3
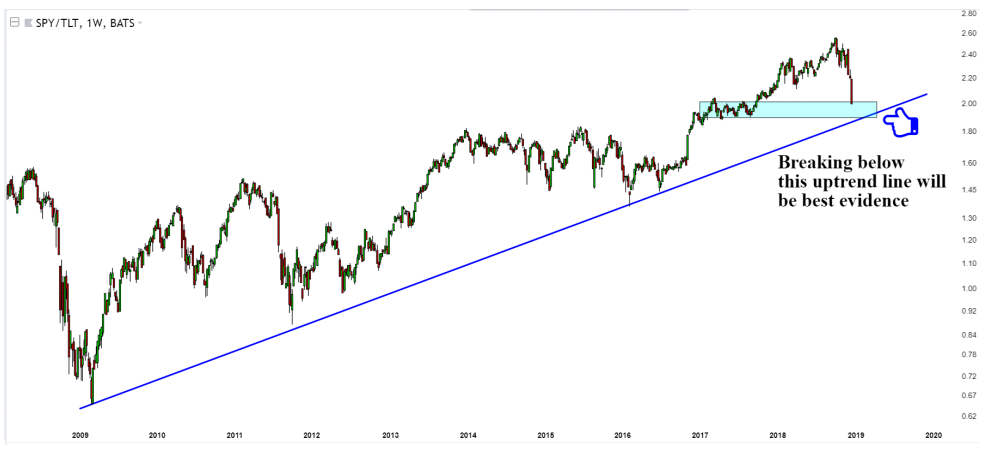
The ratio weekly chart of SPY/TLT shows that uptrend line is not broken down yet, albeit there could be a few more weeks of fear. Until the uptrend line is broken, InvestingHaven’s team is not totally convinced.
Neutral indicator #4
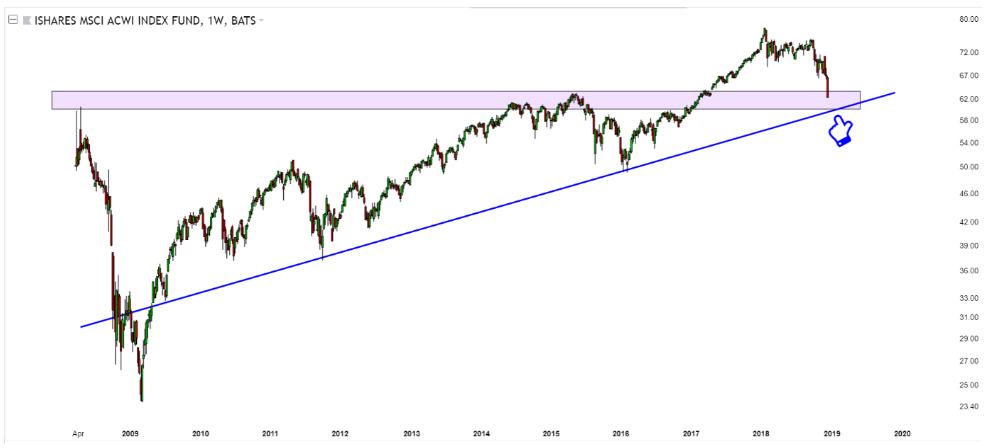
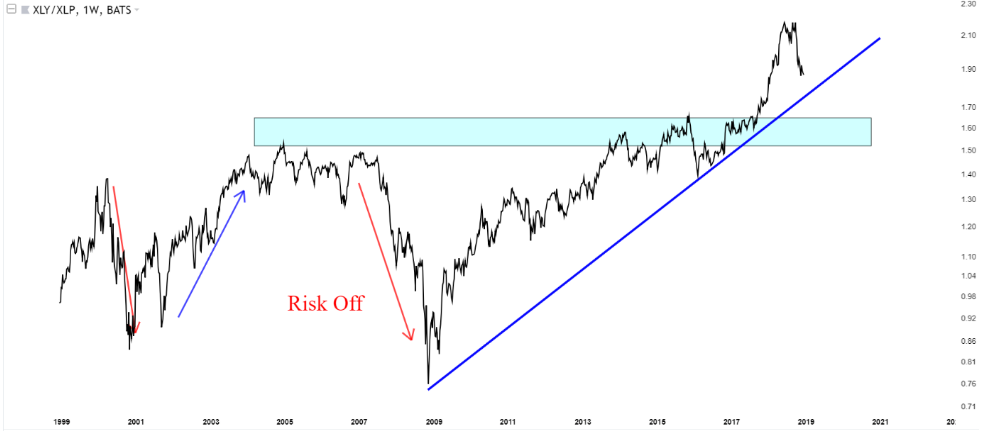
The global index ETF tracker ACWI has a massive breakout above the all-time resistance in April 2017. Technically, this zone needs to be confirmed with a test to confirm that it is a support. Any break below this zone will add evidence to the sustained bearish case.
The weekly XLY/XLP ratio still shows healthy uptrend but currently engage in retracement. However, below the blue zone a strong bear market might be confirmed.
TOP CRYPTOCURRENCIES TO BUY: Which top crypto tips are flashing a BUY signal now? Which to avoid? Top notch guidance on how to play the grand bull market in crypto from InvestingHaven’s research team, only for $2 per week. Crypto & Blockchain investing service >>
