


Is the decline in U.S. stocks over? Or can we expect a global market crash in 2019? Which data point to trust to make this type of call? As said many times we use the small cap index Russell 2000 as the leading indicator for this. It may suggest that the decline in U.S. stocks over, and $1275 is the line in the sand!
It is pretty tough to get to a market bottom call because there are so many data points. So looking at leading indicator which has stood the test of time is imperative.
Here is one such example, a good tweet but how important is this data point to determine a market bottom?
The McClellan Oscillator has gone from -70 to +70 in less than 2 weeks. This happened 10 other times since 1962. All 10 saw the S&P 500 higher a year later.
The Russell 2000 was the first index to create a top but also the first one bottom in the 2000 top and 2002 bottom. Similarly, we saw the Russell 2000 bottom in March 2009, interestingly every time at important inflection points. The 2009 bottom for instance was the same as the 2002 bottom!
So what the Russell 2000 index does at this point in time with the ongoing market turmoil is of above average importance!
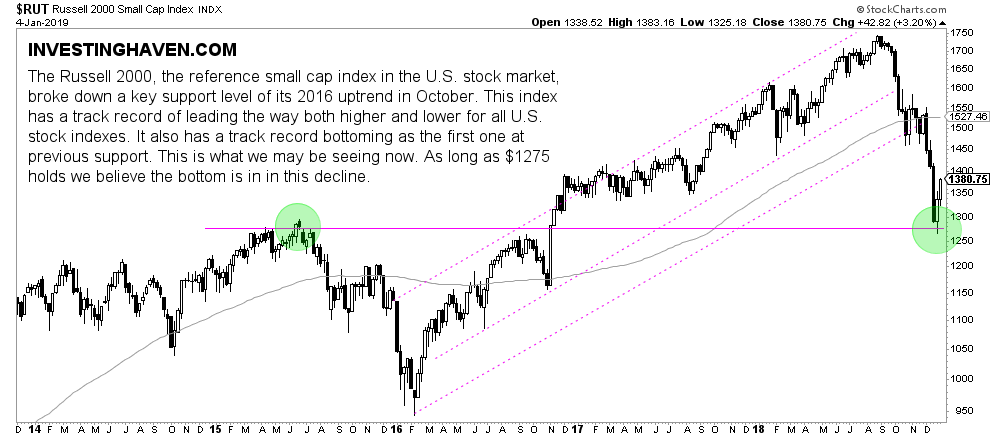
The Russell 2000, the reference small cap index in the U.S. stock market, broke down a key support level of its 2016 uptrend in October. This index has a track record bottoming as the first one at previous support. This is what we may be seeing now.
As long as $1275 holds we believe the bottom is in in this decline. This is the line in the sand, which implies once below $1275 things will get nasty!
TOP CRYPTOCURRENCIES TO BUY: Which top crypto tips are flashing a BUY signal now? Which to avoid? Top notch guidance on how to play the grand bull market in crypto from InvestingHaven’s research team, only for $2 per week. Crypto & Blockchain investing service >>
