


There is so much talk about whether another 1987 alike market crash is near. This is the type of stuff that sells well because it plays on fear. But should we be so fearful in 2019? This article shows why conditions were so different in 1987 compared to today. It reveals this one crucial insight that the crash was visible based on intermarket charts. 5 shocking charts from 1987, and why 2019 will not bring a similar market crash, based on leading indicator analysis.
First, as a general and utterly important remark. In no way are we attempting to play down risk or argue that there is no downside potential. The most important thing is to be prepared for any move or direction in markets. Managing risk is one of the most important things that any investor or trader must do, period.
We are not trying to paint a bullish-only picture. We are no perma-bulls.
We are realistic though focused on our method. That’s why we went back to 1987, and applied our intermarket research method to understand what was happening with the leading market indicators back then.
We have not seen any such analysis but any analyst so far. We consider this our contribution to fact based analysis as opposed to fearful headlines meant to sell well.
1987 Market Crash Coming?
However, any major move is visible somewhere. As per our 100 investing tips intermarket dynamics reveal that capital flows between assets. It’s a closed system so major moves will be visible before they happen. The key point is that it is one primary trend that triggers a domino effect for other markets.
The art of understanding intermarket dynamics is the combination of 3 things: identifying leading assets + reading charts of those assets and respecting chart characteristics of each asset separately + identifying major turning point for each asset. Once this is in place it becomes obvious which asset has a primary or dominant force influencing other assets. This is what we derive from intermarket dynamics, and this is the key to forecast markets.
It is so easy to get caught up on this endless flow of news headlines. How bad will things become? Just read through this recent news:
Are You Ready for the Financial Crisis of 2019? Here are five ways things could get bad for everyone. (NY Times, Dec 18)
Is a Repeat of the 1987 Stock Market Crash Looming? (Yahoo! Finance, Oct 18)
This brutal stock-market rout mirrors the 1987 crash in 1 important way (MarketWatch, Dec 18)
Ghosts Of 1987 Stock Market Crash Suddenly Appear (Forbes, Oct 18)
Market volatility is reminiscent of the 1987 crash: Veteran trader Art Cashin (CNBC, Apr 18)
Feels like you better hide underground with as many ounces of gold and food as you can get your hands on?
5 Shocking Charts From 1987 Market Crash vs. 2019
Let’s get factual now.
As explained our intermarket analysis considers the following:
Any major move in markets is preceded by major trend changes in credit and currency markets. That’s why investors must spot major breakouts, breakdowns and bounces from major support/resistance in secular chart patterns.
Especially the long term charts of 10 year Yields, the USD (also the Euro though not relevant in 1987) and bonds are the ones that are crucial to analyze. They reveal major moves a couple of months before broad markets like stocks.
Leading indicators (10 year Yields, USD, gold) revealed very unusual market conditions many months before the 1987 market crash. In 2019 conditions are different. We watch 10 year Yields closely (2.50 level). Otherwise NO market… Click To Tweet
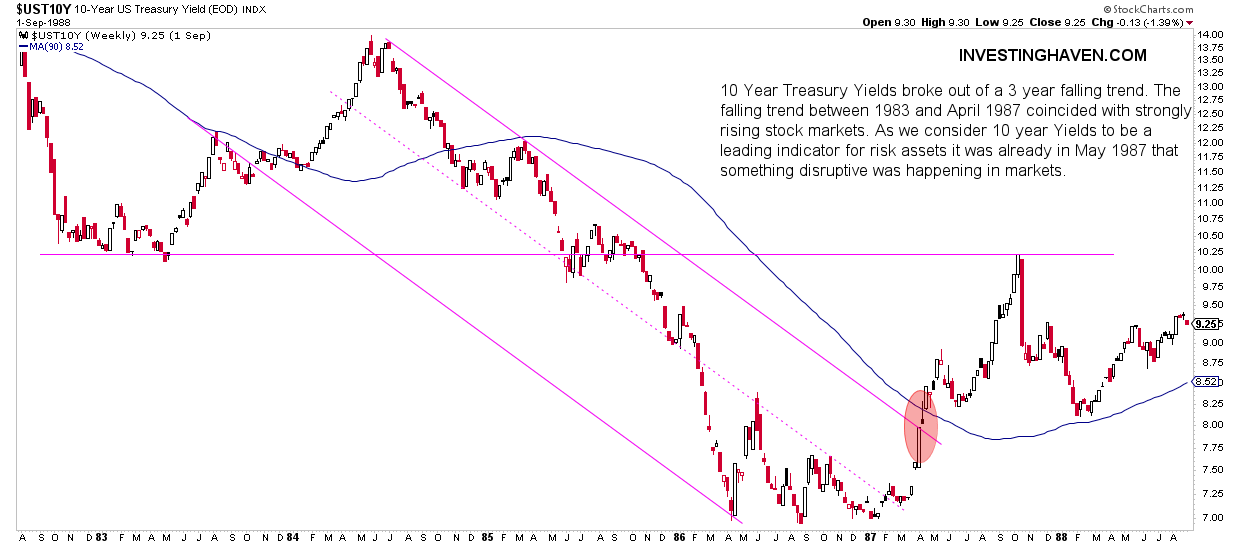
1987 Chart for 10 year Treasury Yields
10 Year Treasury Yields broke out of a 3 year falling trend. The falling trend between 1983 and April 1987 coincided with strongly rising stock markets. As we consider 10 year Yields to be a leading indicator for risk assets it was already in May 1987 that something disruptive was happening in markets.
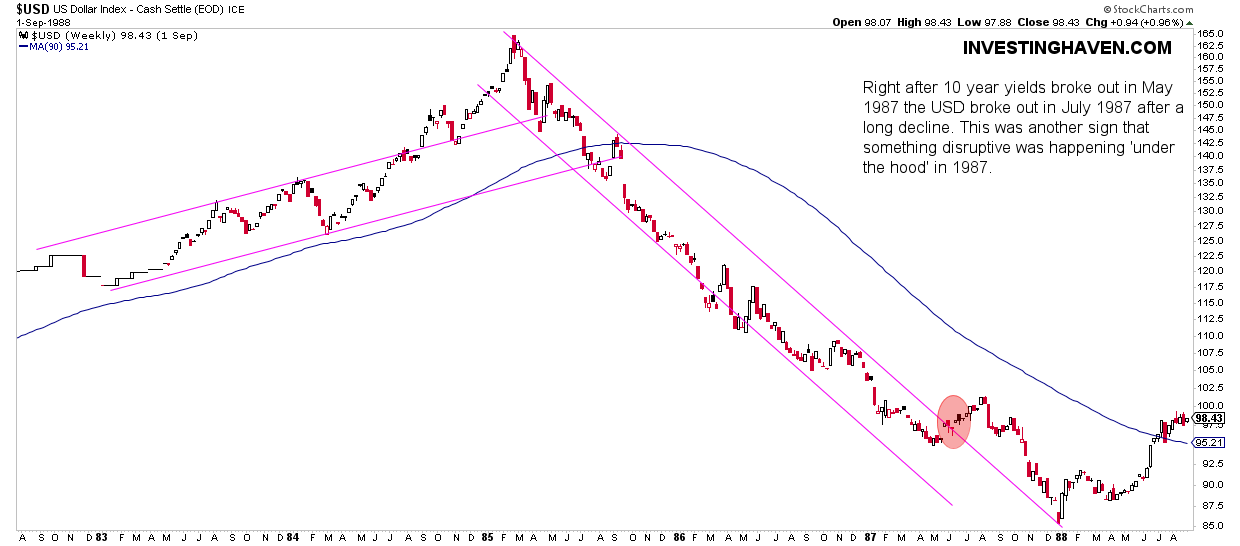
1987 Chart for the US Dollar
Right after 10 year yields broke out in May 1987 the USD broke out in July 1987 after a long decline. This was another sign that something disruptive was happening ‘under the hood’ in 1987.
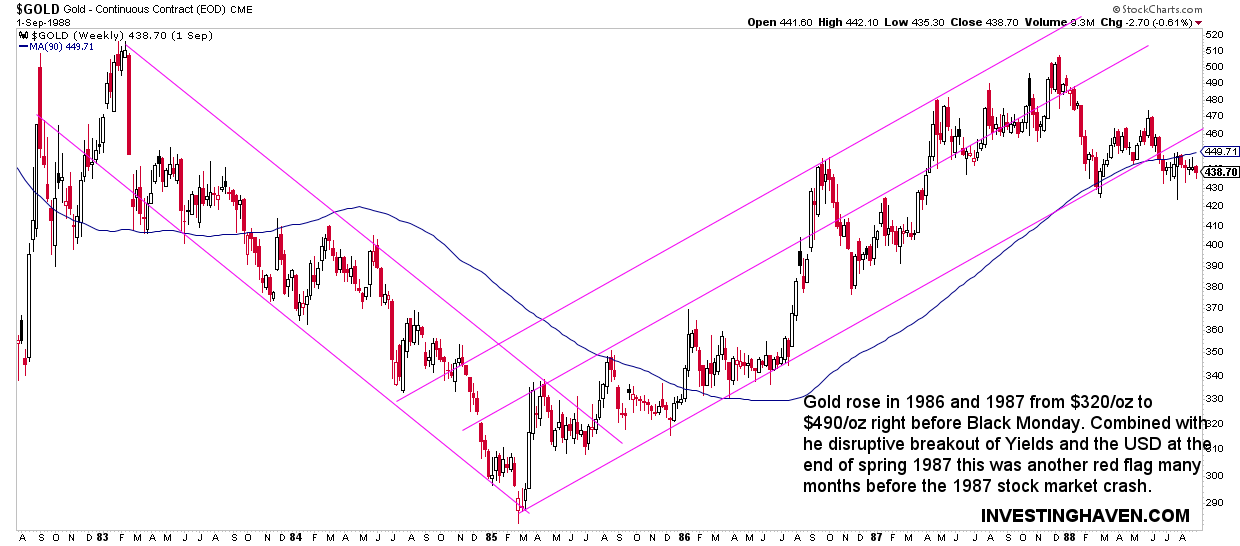
1987 Chart for Gold
Gold rose in 1986 and 1987 from $320/oz to $490/oz right before Black Monday. Combined with he disruptive breakout of Yields and the USD at the end of spring 1987 this was another red flag many months before the 1987 stock market crash.
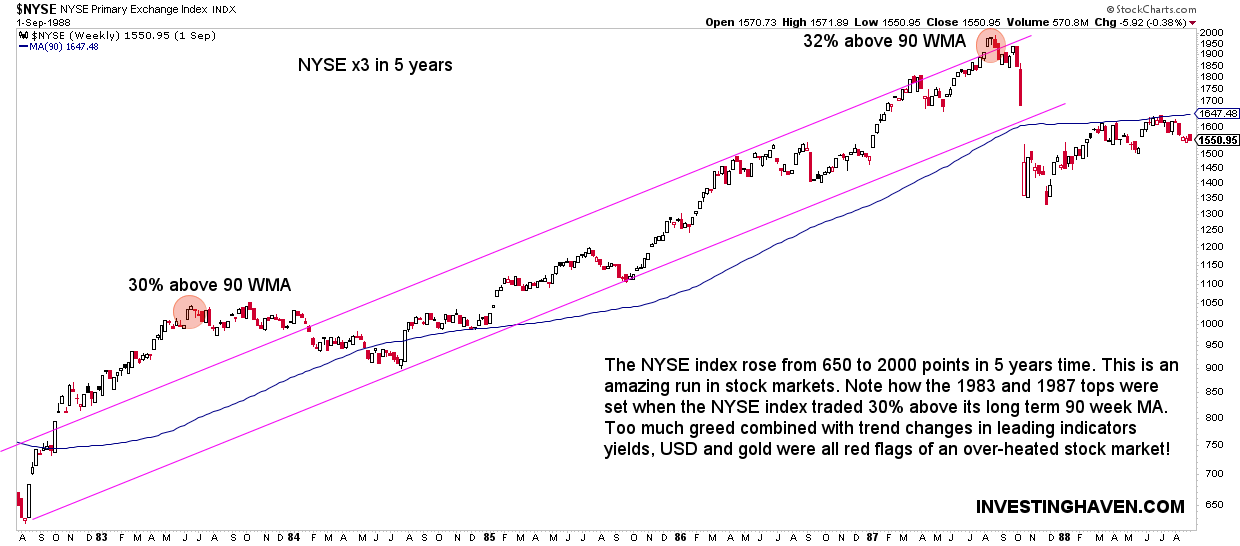
1987 Chart for the NYSE Composite Index
Many focus on the S&P 500 or the long term Dow Jones Industrial Index chart. However, we believe the Russell 2000 or NYSE Composite Index are much more appropriate to analyze as they represent the average stock, not the large caps which may follow other dynamics.
The NYSE index rose from 650 to 2000 points in 5 years time. This is an amazing run in stock markets. Note how the 1983 and 1987 tops were set when the NYSE index traded 30% above its long term 90 week MA. Too much greed combined with trend changes in leading indicators yields, USD and gold were all red flags of an over-heated stock market!
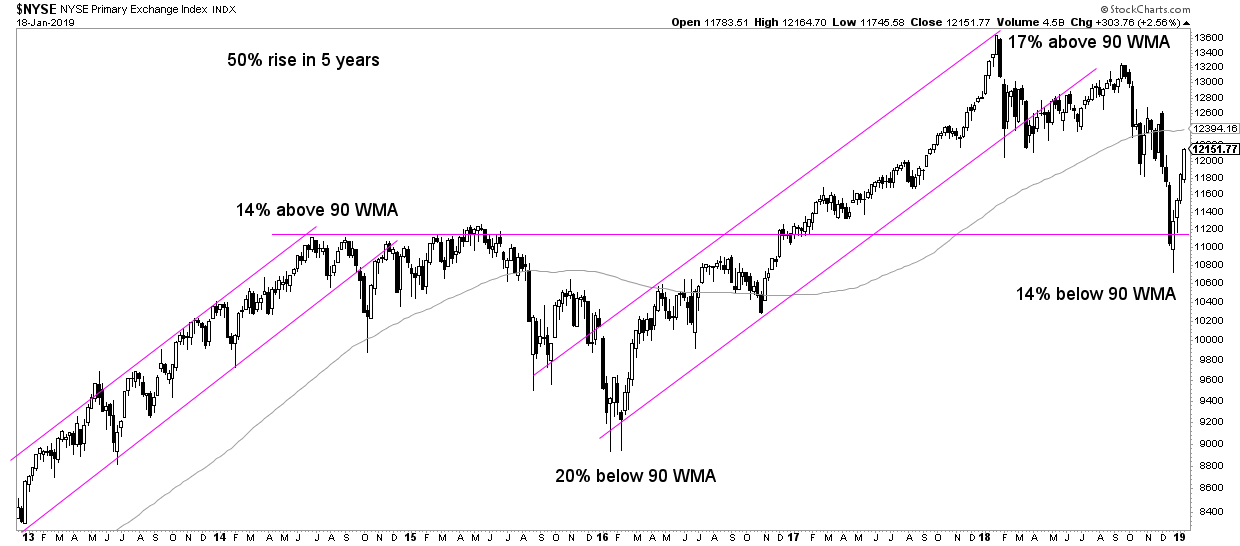
2019 Chart for the NYSE Composite Index
Today we don’t see anything over-extended or over-heated like the conditions in the summer of 1987, especially on the NYSE Composite index. There is a 50% rise in 5 years as opposed to a 3-fold rise back in 1987. The NYSE traded 17% above its 90 week MA while at the 1987 top it was 32%.
Moreover, there is a totally different chart setup with lots of support below current levels.
No 1987 Market Crash in 2019, for sure?
As said, markets can change direction, and they really will not wait for anyone’s permission or prepardness.
So anything can happen in 2019, and we must be prepared and have a clear exit plan. According to our method the exit points are clear:
- 10 year Yields falling fast below 2.50, for sure below 2.20.
- Russell 2000 falling fast below 1200 points.
That’s when things will really become nasty.
However, the chart patterns do not suggest this to happen! That’s because the currency and credit markets did not show major reversals as of yet. The only exception may become 10 year Yields which peaked at 3.25. It might become a major reversal if they continue to fall in which case our thesis outlined in this article gets invalidated. Depending on how fast and deep 10 year Yields may fall it might indeed trigger a 1987-alike market crash scenario.
Still, we don’t see this happening.
Be prepared for any scenario, stay focused on the leading indicators, and invest accordingly. Risk management is crucial, but avoid fear-based decisions is certainly evenly important.
TOP CRYPTOCURRENCIES TO BUY: Which top crypto tips are flashing a BUY signal now? Which to avoid? Top notch guidance on how to play the grand bull market in crypto from InvestingHaven’s research team, only for $2 per week. Crypto & Blockchain investing service >>


