


Our palladium price forecast 2019 of $1375 got hit already a week ago. As palladium is in the news with some good excitement many investors might be seduced to look for an entry point. However, buying palladium at all-time highs might not be the most wise thing to do. This article depicts 2 potential entry points to get exposure to palladium in a high reward low risk manner. In doing so we try to educate readers on the approach to manage risk.
First, the news which, obviously, is creating excitement around palladium. This makes sense because as per our 100 investing tips news is a lagging indicator. The ‘real’ breaking news would have been spotting the entry point when palladium was trading at $500, not at $1400 when it hits all-time highs.
Moreover, in the news, we see some red flags. Specifically, as said by Bloomberg:
“After topping technical barriers such as the 50-, 100- and 200-day moving averages, “palladium has entered uncharted territory,” Thomas Anthonj, technical analyst at JPMorgan Chase & Co., said by email from London. “In such cases, the only orientation we have is from a technical perspective.” The bank bought palladium at $1,357.50 an ounce Wednesday, and, after resistance was breached at $1,343, it now sees the next upside target at $1,587, it said in a note to clients.”
The keyphrase that we underlined, emphasis ours, is the big red flag. JPMorgan was sued a while ago for precious metals market manipulation. They are able to move markets. Now they are on record buying palladium at all-time highs? We don’t think so, this is at best misleading information. It might be true, but it’s not a leading indicator according to us. It has to be taken with a grain of salt, or in other words with a lot of prudence.
Admittedly, it is seducing to buy palladiuim after looking at the chart and see every day prices close in green. It is more prudent though to be guided by decent chart analysis.
This is how we suggest to approach an entry point in this market which may or may not have set a major top for the coming decade. We don’t know at this point. Palladium may also just warm up at this point before running to $2,000 later this year!
The way to approach this is to look at the monthly + the daily timeframes to identify potential entry points, and wait for the market to see how it behaves at those price levels.
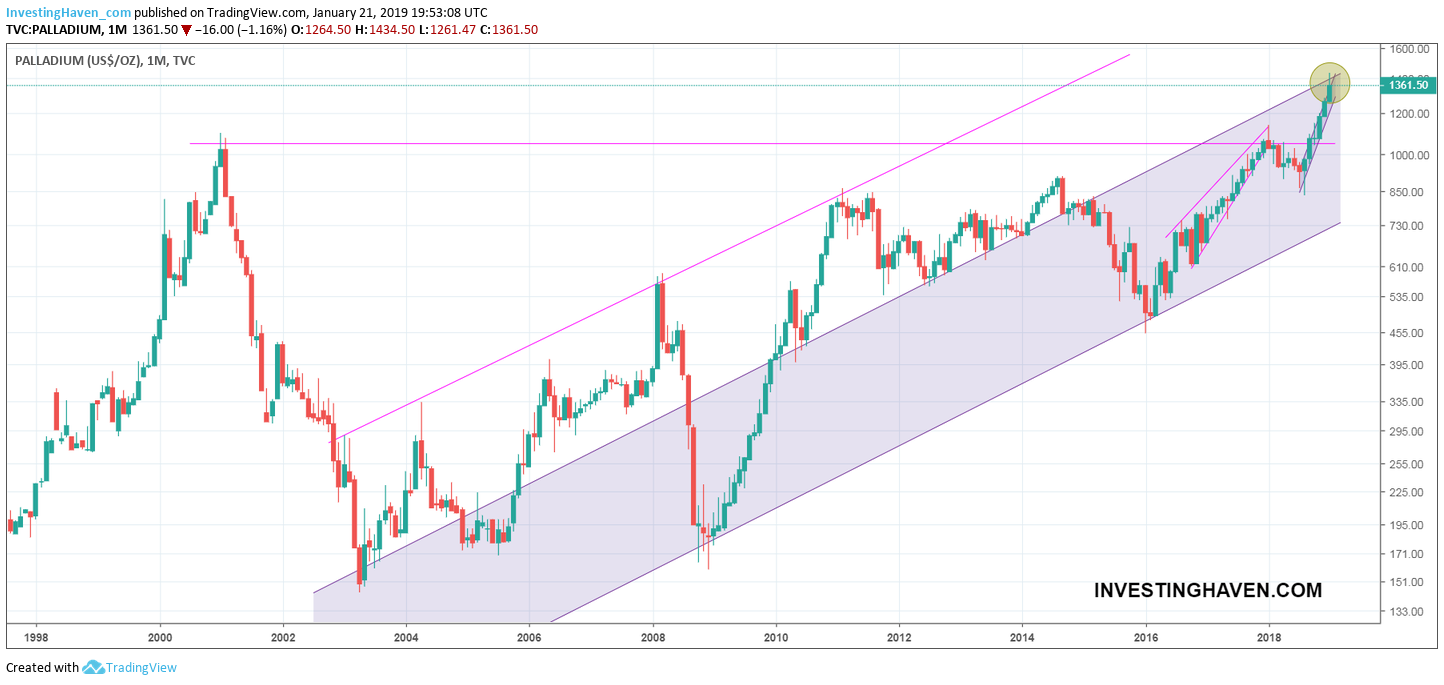
First, the monthly chart shows a double resistance at $1400: two rising channels coincide there. See the yellow annotation. This is a major red flag, and no-go to go long at double resistance. So we have to zoom in and look at the support levels which will be hit and might serve as an entry point.
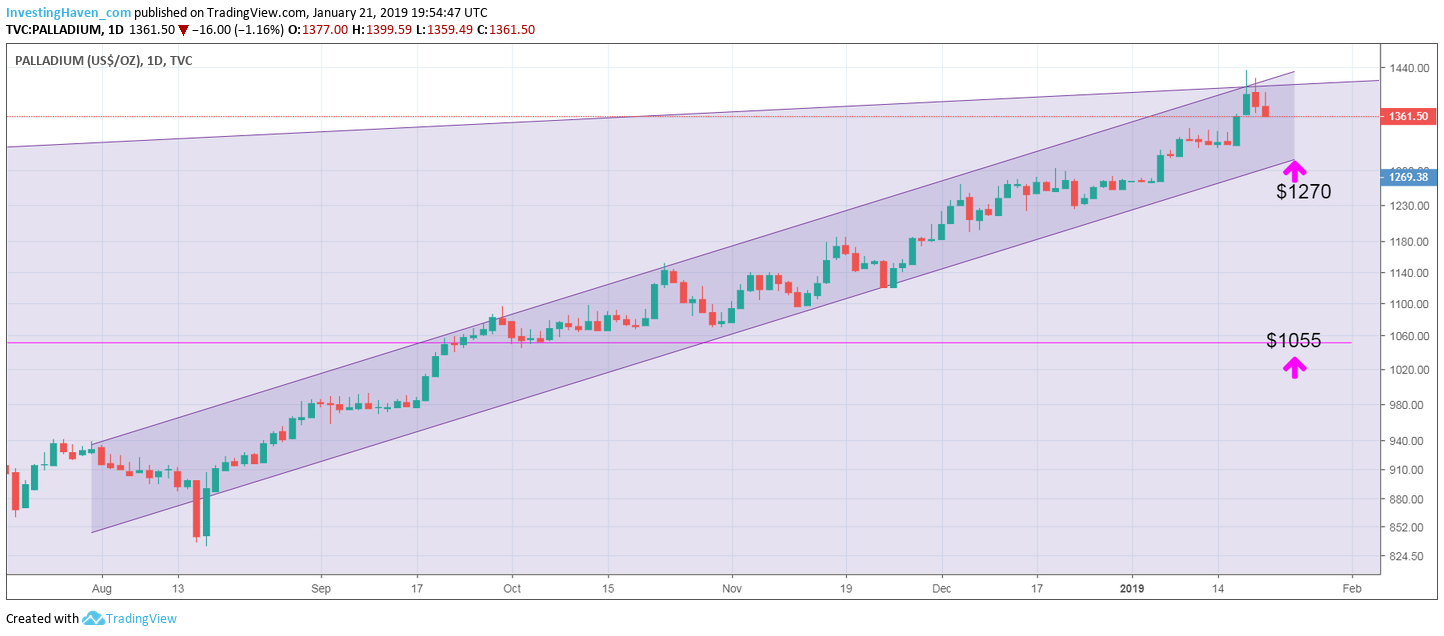
By turning our attention to the daily chart we do something utterly important: we focus on the downward potential, not upward potential. This, in terms of risk management, is crucially important!
How low can the palladium price fall? We see 2 options on the daily chart.
First, the $1270 area is the most obvious point of retracement. It might be an entry point but only provided support holds strong there. If it doesn’t we are looking at $1055 as the second potential entry point.
Note that we are only interested in daily closing prices, not intraday moves.
The coming days we will find out whether $1270 will hold up, and trigger a buy signal. If not, we will wait and focus on what happens at $1055.
TOP CRYPTOCURRENCIES TO BUY: Which top crypto tips are flashing a BUY signal now? Which to avoid? Top notch guidance on how to play the grand bull market in crypto from InvestingHaven’s research team, only for $2 per week. Crypto & Blockchain investing service >>


