Bitcoin Price Analysis: Buyers make sure that price stays above $9,000 following Thursday’s carnage

0
  • BTC/USD dropped below the SMA 20 curve following Thursday’s price action.
  • Both MACD and Elliott Oscillator show increasing bearish sentiment.

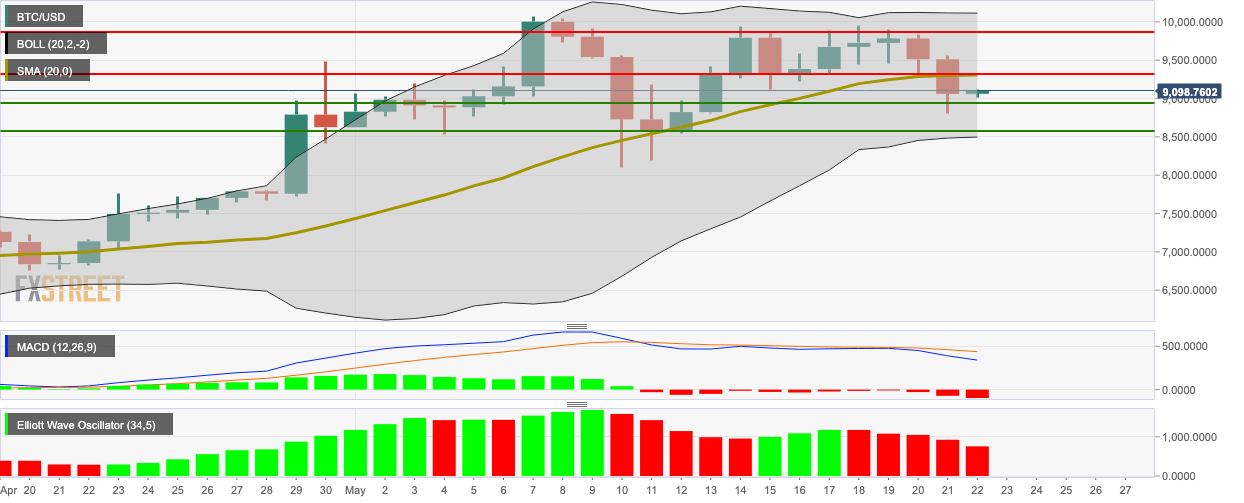
BTC/USD daily price chart

BTC/USD daily chart

BTC/USD went up slightly from $9,060 to $9,091.25 in the early hour of Friday. This follows a hectic Thursday where Bitcoin crashed from $9,520 to $9,060, going below the SMA 20 curve, in the process. The MACD shows increasing bearish momentum, while the Elliott Oscillator has had five straight red sessions.

The bulls need to overcome resistance at $9,313.50, SMA 20 and 9,880.95 to reverse the ongoing bearish momentum. The bears should aim for support levels at $8,948.70 and $8,600 to continue the downward momentum.

Key levels

BTC/USD

Overview
Today last price9081.75
Today Daily Change22.29
Today Daily Change %0.25
Today daily open9059.46
Trends
Daily SMA209300.02
Daily SMA508097.18
Daily SMA1007976.05
Daily SMA2008055.96
Levels
Previous Daily High9567.69
Previous Daily Low8800.12
Previous Weekly High9944.79
Previous Weekly Low8105.58
Previous Monthly High9476.83
Previous Monthly Low6156.67
Daily Fibonacci 38.2%9093.33
Daily Fibonacci 61.8%9274.48
Daily Pivot Point S18717.15
Daily Pivot Point S28374.85
Daily Pivot Point S37949.58
Daily Pivot Point R19484.73
Daily Pivot Point R29909.99
Daily Pivot Point R310252.3

Read more at: https://www.fxstreet.com/cryptocurrencies/news/bitcoin-price-analysis-buyers-make-sure-that-price-stays-above-9-000-following-thursdays-carnage-202005220204

Leave A Reply