


- BTC/USD dropped below the SMA 20 following Friday’s price action.
- The MACD shows increasing bearish momentum.
BTC/USD daily chart
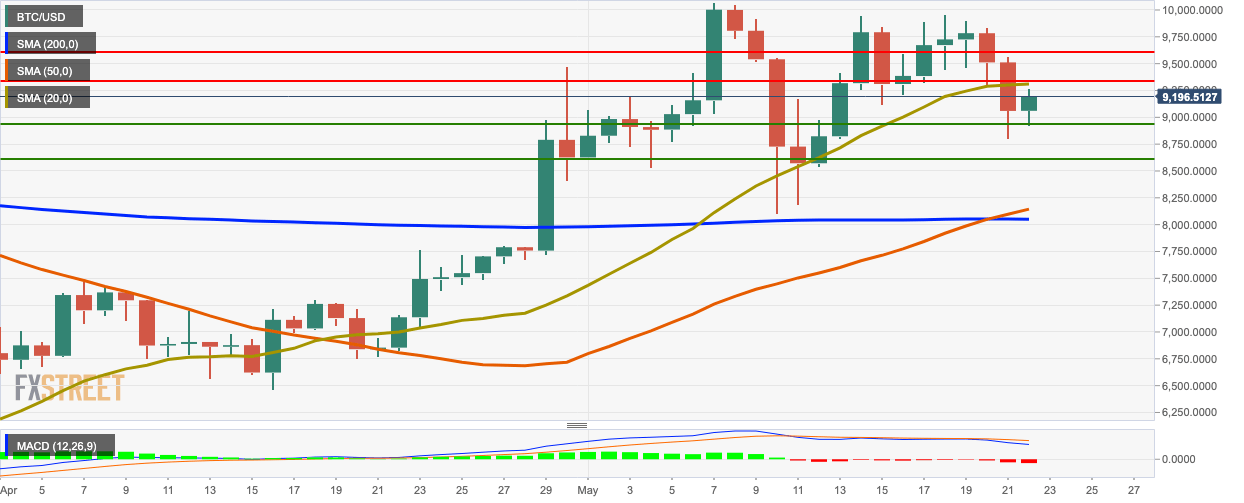
BTC/USD bulls took charge as the price moved up from $9,060.80 to $9,178.70 this Friday. This price action happened after the SMA 50 crossed above the SMA 200 to chart the highly bullish golden cross pattern. The MACD shows increasing bearish momentum.
The bulls need to overcome resistance at the SMA 20, $9,332.15 and $9,621.35. On the downside, healthy support lies at $8,935 and $8,629.55,
Key levels
BTC/USD
| Overview | |
|---|---|
| Today last price | 9203.77 |
| Today Daily Change | 144.31 |
| Today Daily Change % | 1.59 |
| Today daily open | 9059.46 |
| Trends | |
|---|---|
| Daily SMA20 | 9300.02 |
| Daily SMA50 | 8097.18 |
| Daily SMA100 | 7976.05 |
| Daily SMA200 | 8055.96 |
| Levels | |
|---|---|
| Previous Daily High | 9567.69 |
| Previous Daily Low | 8800.12 |
| Previous Weekly High | 9944.79 |
| Previous Weekly Low | 8105.58 |
| Previous Monthly High | 9476.83 |
| Previous Monthly Low | 6156.67 |
| Daily Fibonacci 38.2% | 9093.33 |
| Daily Fibonacci 61.8% | 9274.48 |
| Daily Pivot Point S1 | 8717.15 |
| Daily Pivot Point S2 | 8374.85 |
| Daily Pivot Point S3 | 7949.58 |
| Daily Pivot Point R1 | 9484.73 |
| Daily Pivot Point R2 | 9909.99 |
| Daily Pivot Point R3 | 10252.3 |
Author: Rajarshi Mitra


