


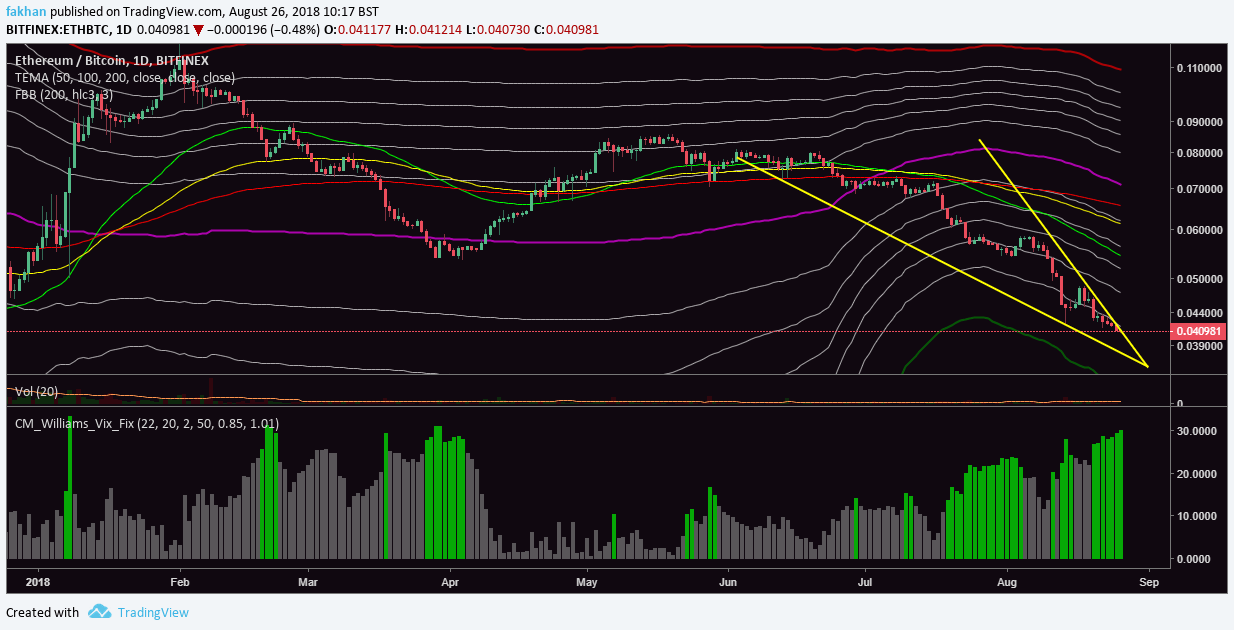
Ethereum (ETH) appears to have reached the full extent of its correction against Bitcoin (BTC). The above daily chart for ETH/BTC shows that the price has been trading in a falling wedge since the month of June and has now reached the end of it. The EMA alignment for ETH/BTC still remains bearish but other factors indicate that a trend reversal is around the corner, not just for Ethereum (ETH) but for the whole altcoin market. The ETH/BTCchart shows that the price of Ethereum (ETH) has found support at the Fibonacci Bollinger bands and is likely to escape the falling wedge by early September at the latest.
Ethereum (ETH) is the largest platform coin and the second largest coin by market cap. If it moves against Bitcoin (BTC), the rest of the cryptocurrency market follows as we have seen in the past. The conditions this time are ripe for an altcoin season as most cryptocurrencies including Ethereum (ETH) have completed more than 80% corrections since their all time highs. VIX profile for the above chart shows that the price of Ethereum (ETH) has been throwing us signs of a bottom the last few weeks. The past few days have shown consecutive green bars on the VIX profile which is a strong sign of a trend reversal.
The total market cap of cryptocurrencies excluding Bitcoin (BTC) is $99.7 Billion. Ethereum (ETH) dominates 28% of that market with a market cap of $27.9 Billion. Additionally, most of these altcoins are paired to Ethereum (ETH) on most exchanges which means that they are directly influenced by a rise or fall in the price of Ethereum (ETH). So, if Ethereum (ETH) completes a correction and braces up for a trend reversal, it is reasonable to assume that most altcoins, having also completed more extensive corrections, will follow. The market dominance of Bitcoin (BTC) is currently at 53.7%, but it is expected to fall in the weeks ahead when the altcoin rally commences.
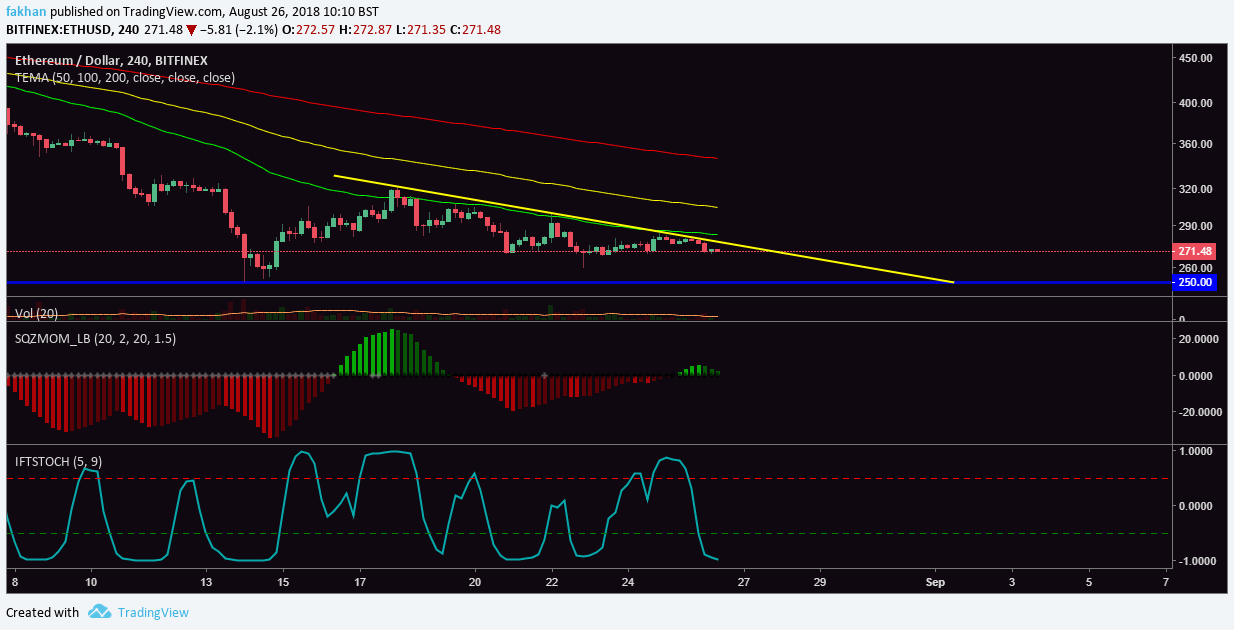
Ethereum (ETH) is preparing for a breakout more aggressively on lower timeframes. The 4H chart above for ETH/USD shows that the price is on the verge of breaking out a triangle which it has been trading in since August 16, 2018. Squeeze Momentum profile for the above chart shows that the bearish momentum is lost and that a series of bullish rallies can be expected in the days ahead. Ethereum (ETH) is currently down 81% from its all time high of $1,448 but future prospects seem brighter than ever.
IFT Stochastic conditions on the above chart confirm our bullish bias as the price is likely to break downtrend resistance before the beginning of September. EMA alignment remains bearish on the 4H timeframe as well but the gap between 50 EMA and 100 EMA is starting to bridge as price eyes a trend reversal. Volume has been drying up on shorter timeframes which means it has now become easier for the bulls to turn the market around with far less effort.
