


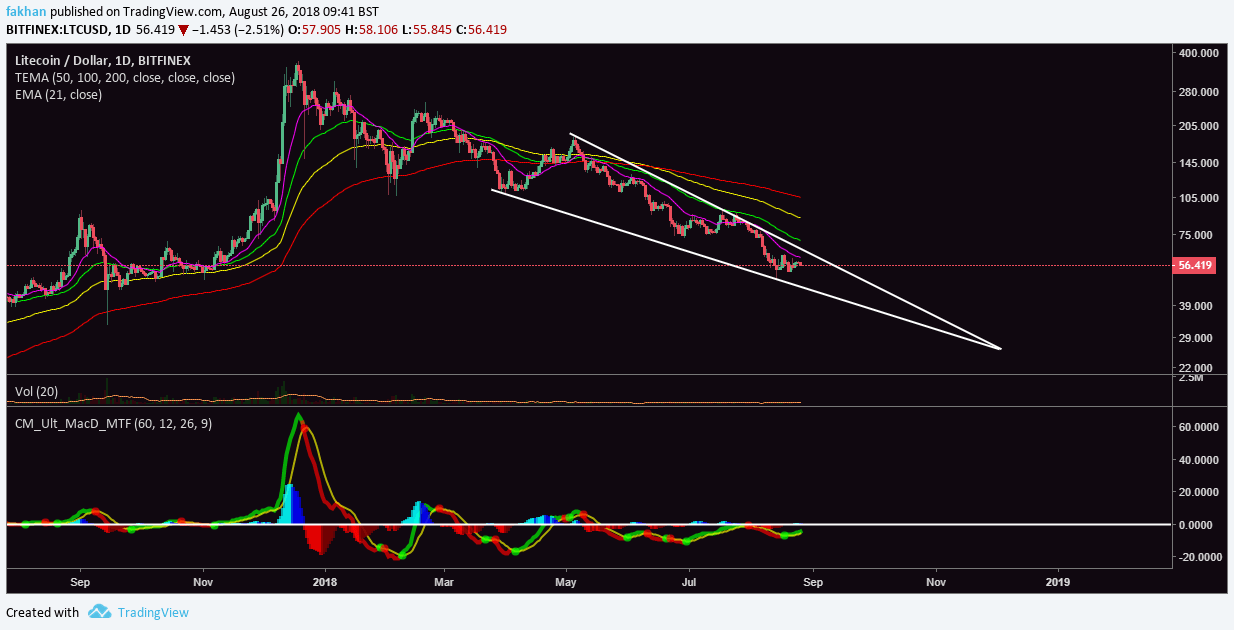
Litecoin (LTC) is trading in a falling wedge with the possibility of a breakout in the weeks ahead. The above daily chart for LTC/USD shows that Litecoin (LTC) has almost reached the extent of its movement within the falling wedge against the US Dollar (USD) and is now likely to test the downtrend resistance. However, before testing the downtrend resistance, it will have to break past the 21 EMA which has served as a support turned resistance since the beginning of the correction.
MACD profile for the above chart confirms a bullish outlook and the price looks all set to break out by early September. The price of Litecoin (LTC) has traded in a series of falling wedges since the beginning of the correction and has now reached a turning point where a reversal is expected. EMA alignment for LTC/USD continues to remain bearish, but the gap between the 21 EMA and 50 EMA is quickly narrowing as the price prepares to escape the falling wedge.
Volume for LTC/USD has also been on a constant decline since the beginning of the year. The price of Litecoin (LTC) is now down more than 84% since its all time high of $360. The overall sentiment regarding a trend reversal for Litecoin (LTC) remains bullish at this point. There are a growing number of people who prefer to use Litecoin (LTC) and Bitcoin Cash (BCH) for most online transactions. The number of users that actually spend Litecoin (LTC) to shop online is still low but it is higher compared to other cryptocurrencies.
A popular Litecoin (LTC) company, Litepay previously ceased operations but it is expected to resume as the market recovers and people start using cryptocurrencies to buy online. Recent economic crises all over the world like the ones in Turkey and Iran have convinced more people to turn to cryptocurrencies for more stability and protection as governments with failing policies are no longer trusted by people with their money. Currently services like Coinbase and Bitpay accept payment via Bitcoin (BTC) but most people do not want to spend their Bitcoin (BTC) either because it is expensive or because they want to keep on to them as store of value.
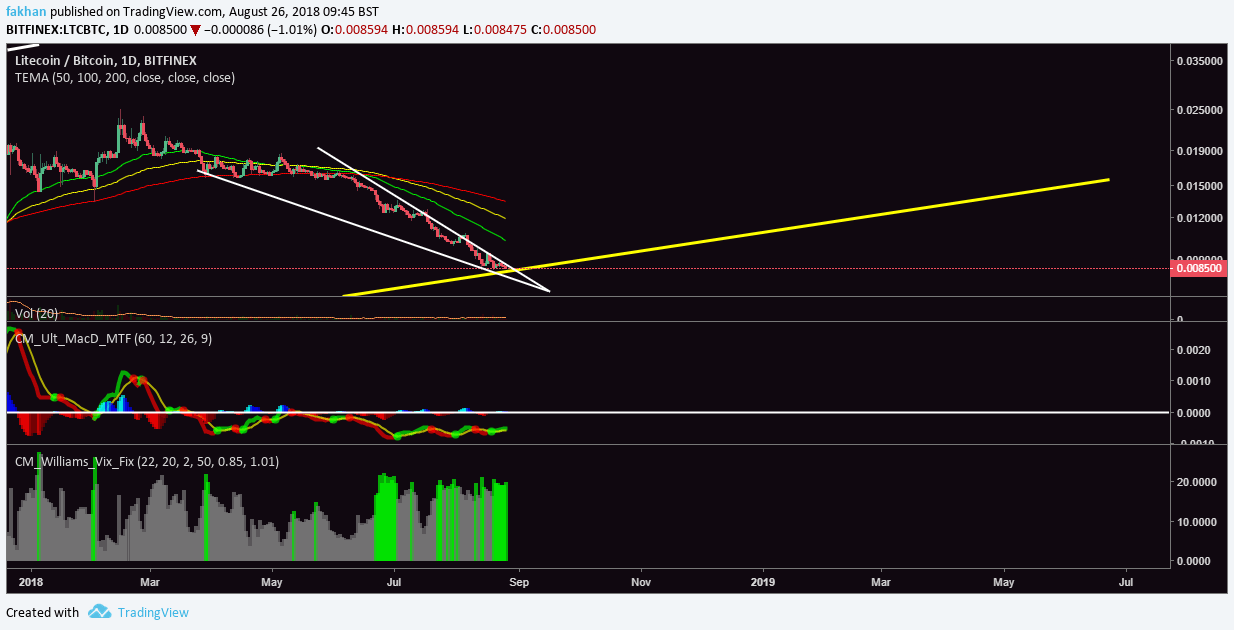
Litecoin (LTC) appears to have completely bottomed out against Bitcoin (BTC). The above daily chart for LTC/BTC shows Litecoin (LTC) trading in a falling wedge. The price has now run into a support line and is all set to break out of the falling wedge against Bitcoin (BTC). Additionally, the MACD profile shows the price of Litecoin (LTC) due for a massive breakout against Bitcoin (BTC) for the months ahead.
VIX profile for LTC/BTC on the above chart also shows several green bars consecutively for the past few weeks which goes on to show that the price of Litecoin (LTC) has reached the full extent of its correction against Bitcoin (BTC) and is now due for a trend reversal in the weeks to come.
