


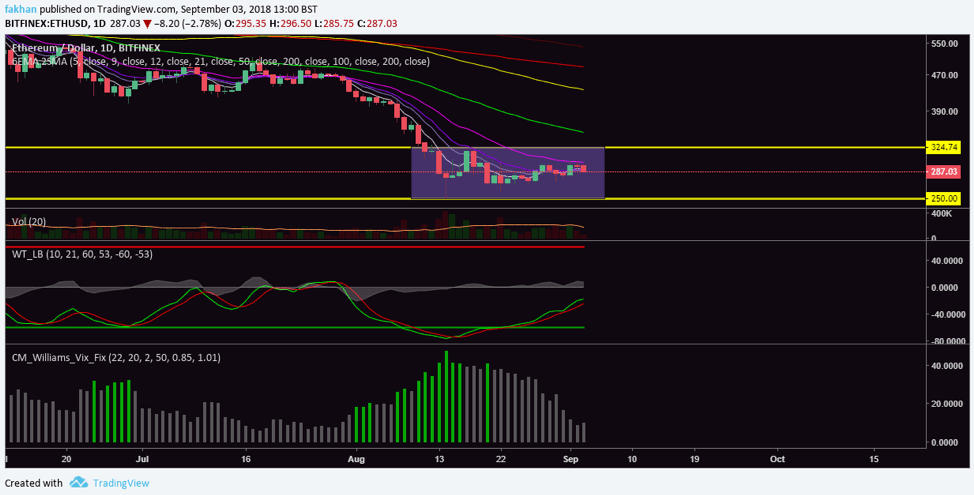
Ethereum (ETH) remains range bound as ETH/USD fails to break the 21 EMA resistance on the daily time frame. The price started trading between $324 and $250 since August and has yet to break out. EMA alignment for the above chart shows that a breakout is imminent and the price is likely to begin a new rally from here. Wave trend analysis for the above chart also shows that the price could begin another rally at this point but the chances of it breaking past the 200 EMA are very low.
Ethereum (ETH) will begin a new rally at this point as it has done in the past but it does not seem to have the strength to push for a trend reversal at this point. The price will have to consolidate at a higher level after it breaks the 21 EMA and completes a new rally. The price of Ethereum (ETH) on the daily time frame seems to have already found a bottom in August as indicated by the green lines on the VIX profile for ETC/USD on the lower half of the above chart. Seven consecutive green bars on the VIX profile suggest that there is a high possibility that a bottom is in for Ethereum (ETH) which would appear to be the price of $250, and that the price is likely to begin a new trend from here.
However, the MACD diagram does not support a trend reversal at this point which means that as suggested by the VIX profile, the bottom is already in but a trend reversal will have to wait for now. The price could begin another pattern of sideways movement after an imminent rally from these levels. On the other hand, if the price falls through the 5 and 10 EMA supports to test the $250 support again, this will extend the duration of range bound movement and Ethereum (ETH) will then be expected to continue to trade sideways for the most part of the month of September.
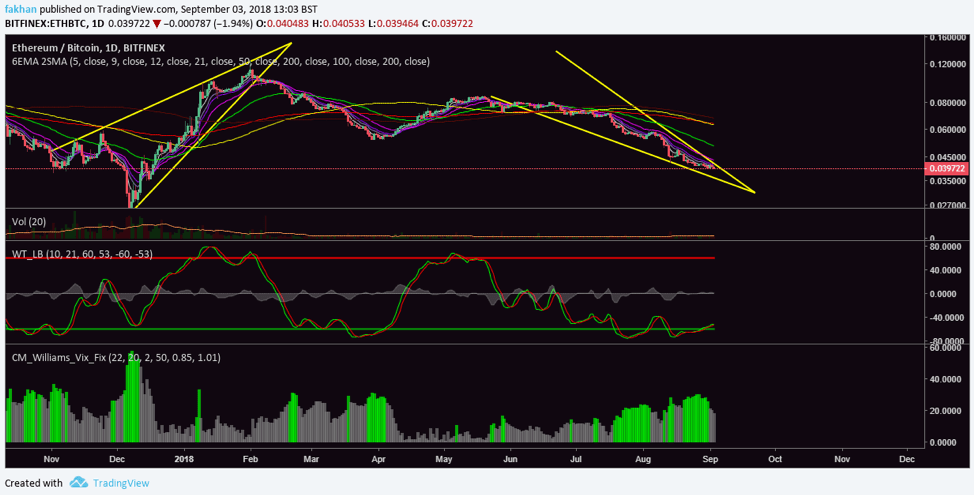
Ethereum (ETH) has an exact similar situation on the ETH/BTC front. The daily chart above for ETH/BTC shows that the price of Ethereum (ETH) has been trading in a falling wedge, which is a bullish indicator but the price has just run into a resistance and is unlikely to break out of the falling wedge at this time. This means that Ethereum (ETH) is highly likely to sink to lower levels against Bitcoin (BTC) in the days ahead. The price will have to test the lower limit of the falling wedge now before it can rise again to break the falling wedge and begin a new trend. MACD diagram as well as the VIX profile for ETH/BTC at this time is strongly in favor of a trend reversal from current levels but both of these indicator show room for the possibility of a last wave down to lower levels against Bitcoin (BTC) before a new trend can begin.
