


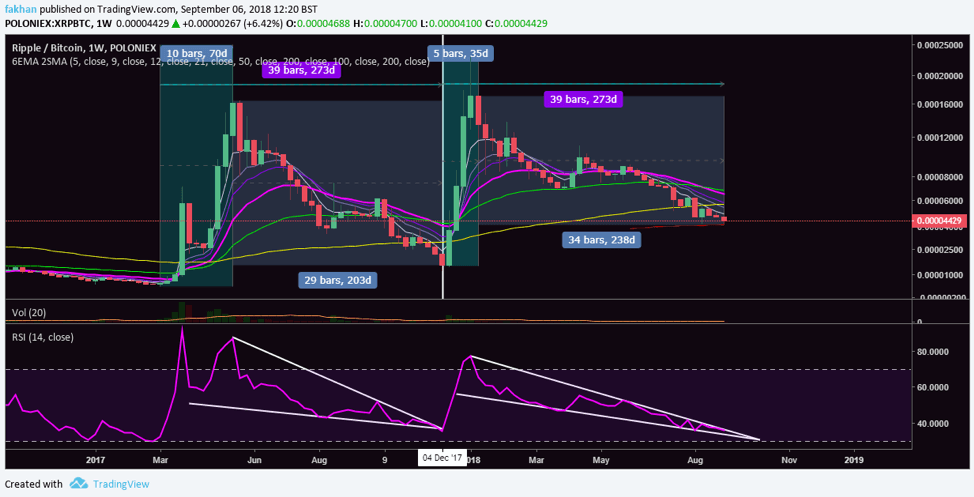
Ripple (XRP) has finally found support above the 200 week EMA as shown by the XRP/BTC weekly chart above. This might seem trivial considering Ripple (XRP) has broken a serious of EMAs during the past few months without putting up a fight. However, this time around, Ripple (XRP) seems to be completing a cycle in addition to finding a strong support. The previous cycle for Ripple (XRP) lasted a total of 273 days. If this cycle is to last for a similar duration of 273 days then this would be the final week in red for Ripple (XRP).
The chart also shows that Ripple (XRP)’s bullish cycle in early 2017 comprised of two parts as after the first pump, some investors gave up thinking the rally was over but soon it was followed by another rally. The second bullish cycle in late 2017 was more coherent and decisive as most investors this time expected Ripple (XRP) to make a similar rally as before which it did and the price rose the same way against Bitcoin (BTC) to complete a bullish cycle. This time around, the price had a similar correction and is now once again expected to rally same as it did back in late 2017. As we have seen in the past, historical behavior of an asset has important implications as far as future price action is concerned.
If history is any indication, the rally at this point should be even more aggressive and fluid than it was back in 2018. RSI conditions for XRP/BTC are surprisingly very similar to the one in late 2017 before the big bull run. As the chart above shows, the RSI for XRPBTC was trading along the upper limit of the falling wedge back in late 2017 before the trend reversal. This time the RSI is following the exact same pattern by trading along the same upper limit of the falling wedge. Just like before, the RSI can be expected to fall slightly below the falling wedge before it continues hire as the whales will attempt one last time to trick any amateur investors into thinking the falling wedge is rendered void and that the market can fall further.
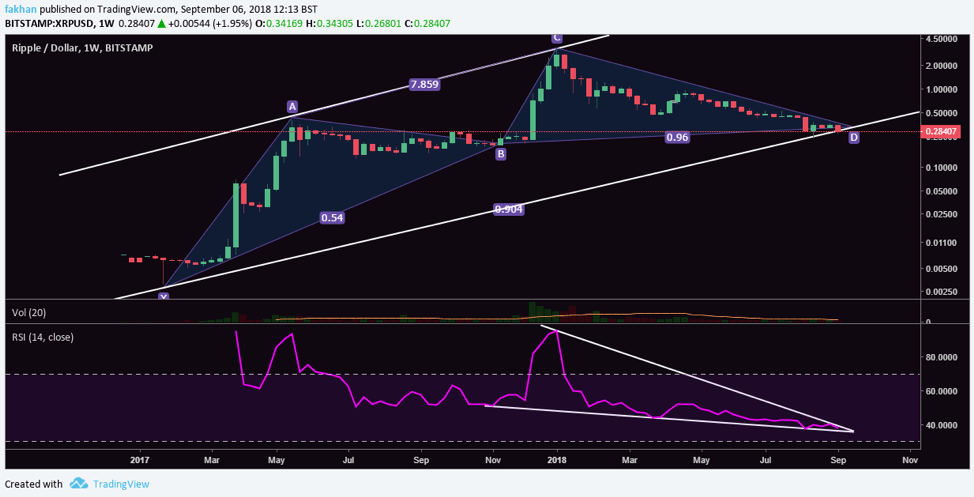
Things could not be any clearer on the XRP/USD front as shown by the weekly chart above. The price has just fully completed a bullish gartley pattern and is now all set for a trend reversal. RSI conditions for XRP/USD look even more bullish than the ones for XRP/BTC. This is because the RSI has reached the full extent of its movement in a falling wedge and is expected to breakout before the end of September. It is not advisable to wait for a perfect bottom to enter a market but if anyone was waiting for one, this would be it. There may be one final wave down before the trend reversal occurs to shake out the last bunch of weak hands but I can assure you it will not be easy to catch that wave. So, if you are looking to invest in Ripple (XRP) this would be a good entry point to dollar cost average your way in.
