


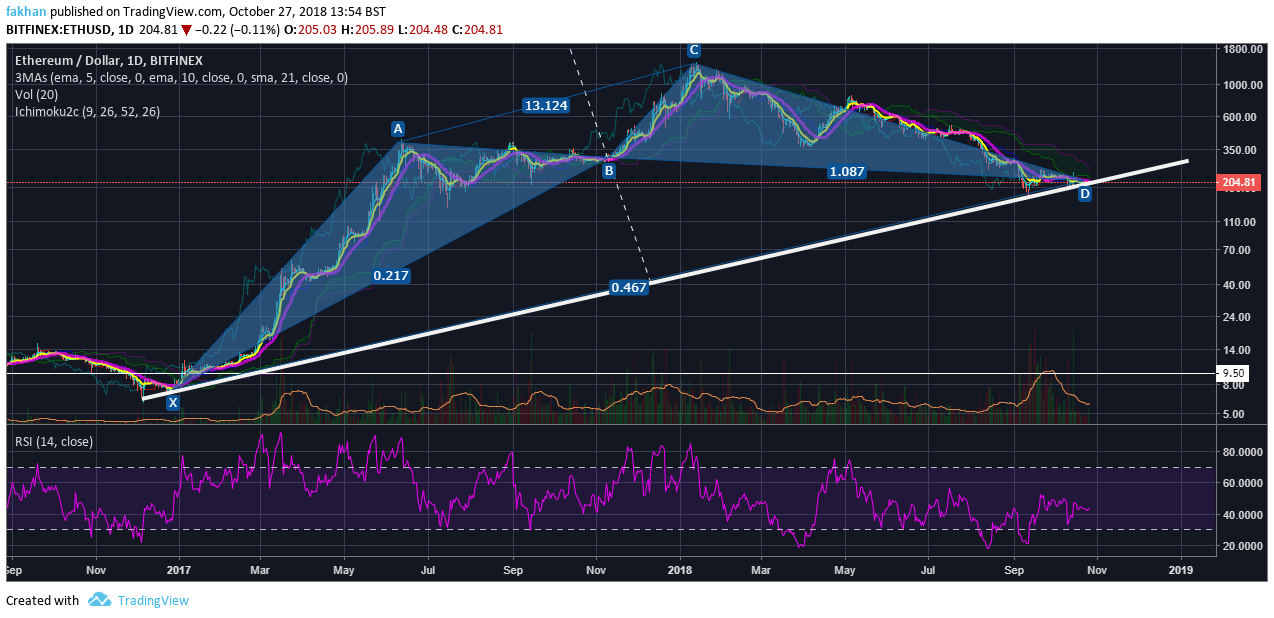
Chart for ETH/USD (1D)
Ethereum (ETH) currently trades slightly above $200. Its price has now stabilized atop the trend line that has also served as a strong support. However, some institutional investors believe that Ethereum (ETH) is in the middle of a bear trend. This means that they expect the price to settle around $50 in order for this correction to be considered over. Looking at the ETH/USD daily chart above, we can clearly see that a bullish gartley pattern has just been completed. This is a very bullish development that should set the ground for a new bullish cycle. However, there are there are some factors that signal that further downside although unlikely is still very much possible.
The price of Ethereum (ETH) has been consolidating for the past few weeks but there is no clear direction. Since the beginning of this correction, the volume for ETH/USD started to decline steadily. However, in September the volume started to rise significantly and even reached a new all time high but the exuberance was short lived. There was one prominent big green candle visible on the volume profile. This was likely the result of a big buy order placed through an exchange. It did result in some FOMO for the time being but the whales were quick to dump on unsuspecting retail investors. As a result, the rally was stopped and the volume started to decline. Since then, we have seen plenty of news regarding institutional interest as well as favorable regulatory developments. However, none of them seem to have any impact on the price.
As a contrarian, one would like to think that the prevailing negative sentiment in the market signals an imminent trend reversal. If the circumstances were different, this would have been a strong signal for many and we would definitely have seen a reversal by now. However, there is a reason big investors are waiting on the sidelines. Most of us would like to believe that cryptocurrencies are classed as commodities and thus have nothing to do with the stock market. However, as we have seen in the past it is not that simple. In fact, we have seen a strong correlation between cryptocurrencies and the stock market, even if it is short-lived. This is the reason many investors are waiting on the sidelines. They fear that a big downswing on Wall Street might translate into an extended correction in cryptocurrencies, even if it lasts for just a few weeks.
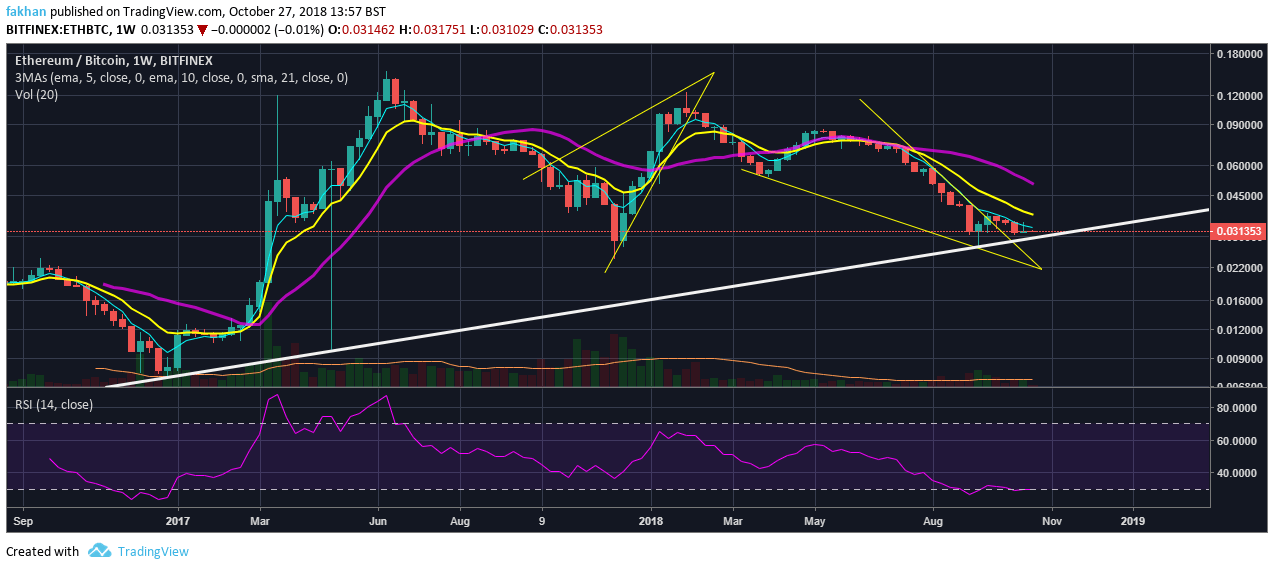
Chart for ETH/BTC (1W)
Commodities like Gold and Silver most often have a negative relation with the stock market. This is especially true when the stock market is falling. This is because investors see Gold and Silver as safe haven assets. However, if you look at the immediate correlation between Gold and the Stock market for the first few weeks of a stock market correction, generally Gold falls as well. This goes on to show that some correlations might hold true for long term but short term, markets can act irrationally. Of course, there are explanations for that sometimes. For instance, an investor trading stocks on margin might have to sell some of their gold in order to avoid a margin call. The same goes for Ethereum (ETH). If the stock market takes a hit, we may see further downside in Ethereum (ETH) as an immediate response.

