


Ripple (XRP) has pulled back 40% from September highs and remains down 88% from the record high set in January. The market cap is 3rd among all crypto assets and now stands at US$18.3 billion with US$606 million in trade volume over the past 24 hours.
The suite of tools for enterprise and banking solutions that make up RippleNet is currently available in 40 countries. The tools are provided by the company behind XRP, Ripple Labs, and include; xCurrent, which processes global bank to bank payments for customers and is analogous to SWIFT; xRapid, which went live on October 1st and sources on-demand liquidity through buying and selling the XRP token; and xVia, which plugs into RippleNet to send unidirectional payments. A report by RBC capital markets in late June found that RippleNet processed transactions in 3-5 seconds, as opposed to multiple days when compared to traditional settlement procedures, and saved users 46% in costs.
Ripple also has two other monetary arms to foster the growth of the ecosystem. XPRING is a venture capital arm, which invests in, incubates, acquires, and provides grants to companies and projects run by proven entrepreneurs. Ripple’s university research initiative has $50 million in funding for grassroots research and development.
The XRP ecosystem also includes Interledger, Coil, and Codius, all of which are related in terms of functions and development teams. The Interledger Protocol (ILP) is capable of sending payments across different distributed and decentralized ledgers, moving funds via intermediaries. Coil enables subscription based donations for content monetization on the internet, without advertising or selling user data, and pays sites in real-time through a Web Monetization API. A similar micropayment system for content monetization is used by the Brave browser. Codius is a smart contract and smart program platform allowing for interoperability between blockchains. Earlier this month, the Bill & Melinda Gates Foundation announced plans to use ILP and Coil, in conjunction with Mojaloop, to bring payments to the under and unbanked.
Highlights of the company’s Q3 report include; Ripple selling $163 million XRP over the course of the quarter, which accounted for 0.43% of global XRP volume. 3 billion XRP were released from the cryptographically-secured escrow with 2.6 billion XRP returned to escrow. Ripple also recently hired Amir Sarhangi, previously a Google developer with a background in Rich Communication Services (RCS) messaging.
On the network side, there are 921 public nodes with 140 validators. The top 100 largest XRP accounts hold 80% of the money supply. Transactions per day have continued to decline since January, and are currently at levels last seen in 2014. The average transaction fee to send XRP, which correlates with network traffic, has been minimal when compared to other coins, and is currently around US$0.001 for each transaction. Most of these transactions are generated by the OfferCreate function, a currency exchange facility.
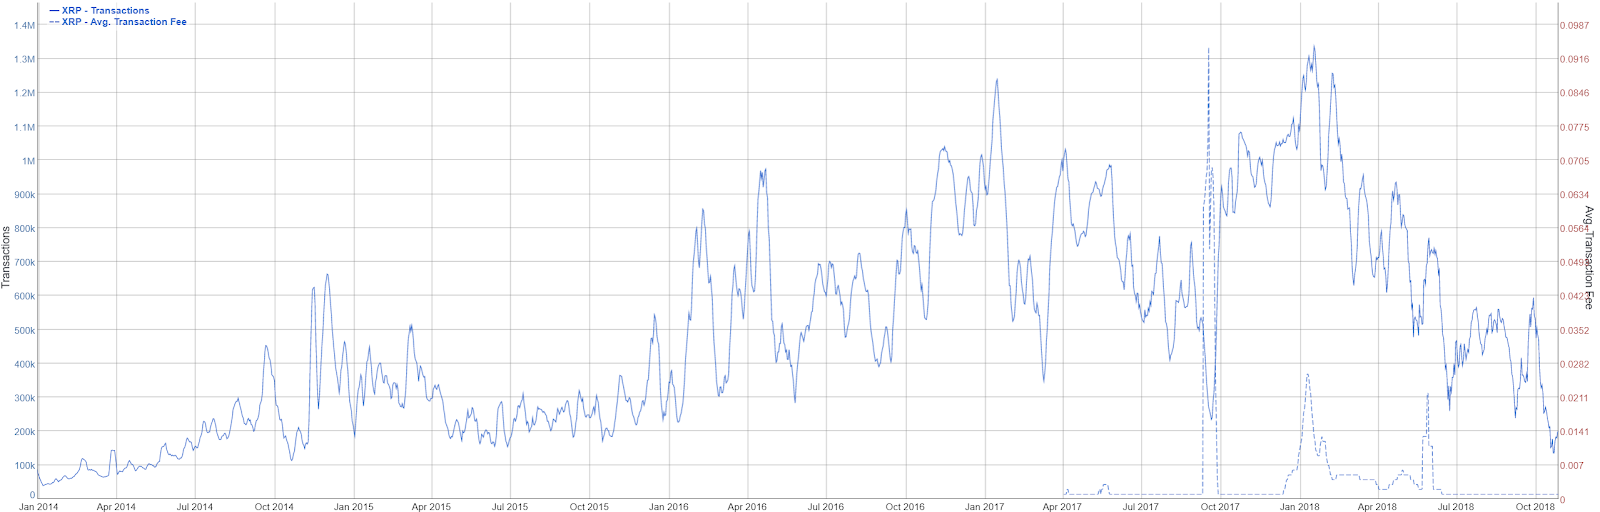
Source: bitinfocharts.com
Kalichkin’s 30-day network value to estimated on-chain daily transaction ratio (NVT) has steadily increased since mid-April (line, chart below). NVT is now at an all-time high, which indicates decreased transactional value and utility. A rising NVT at record levels should be considered extremely bearish for price. Although NVT is difficult to compare between coins, which use different transactions types, it can be useful when comparing a networks relative utility over time.
Daily active addresses (DAA) have decreased substantially since January (fill, chart below) although data between April and July is absent. DAA is currently sitting at levels last seen during the July to October period last year. A large uptick in DAA should be seen as a bullish indicator for price, as it suggests increasing demand.

Source: coinmetrics.io
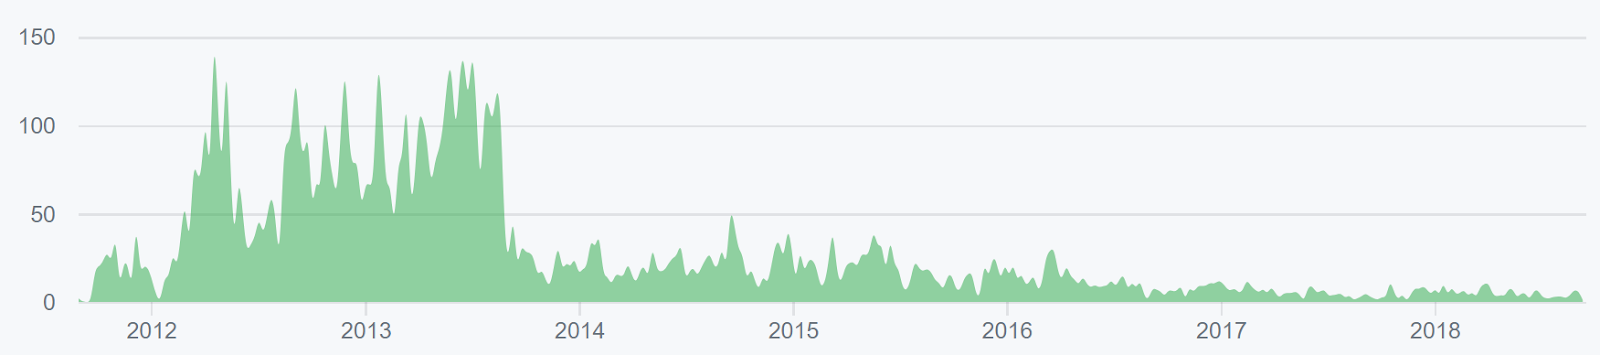
Turning to developer activity, the main repo for the XRP project on GitHub has had a cumulative 25 commits over the past 90 days and 243 commits over the past year. Most coins use the developer community of GitHub, which was acquired by Microsoft for US$7.5 billion earlier this year. Files are saved in folders called “repositories,” or “repos,” and changes to these files are recorded with “commits,” which save a record of what changes were made, when, and by who. Although commits represent quantity and not necessarily quality, a higher number of commits can signify higher dev activity and interest.
Recent exchange traded volume has been led by the Bitcoin (BTC), U.S. dollar (USD), Euro (EUR), and Tether (USDT) pairs. The majority of trading has occurred on ZB.com, HitBTC, Bithumb, and Binance. A new Estonia-based exchange, XRP United, went live this week with three XRP-denominated trading pairs: BTC/XRP, ETH/XRP, and BCH/XRP. A further pair, XMR/XRP, will be integrated soon.
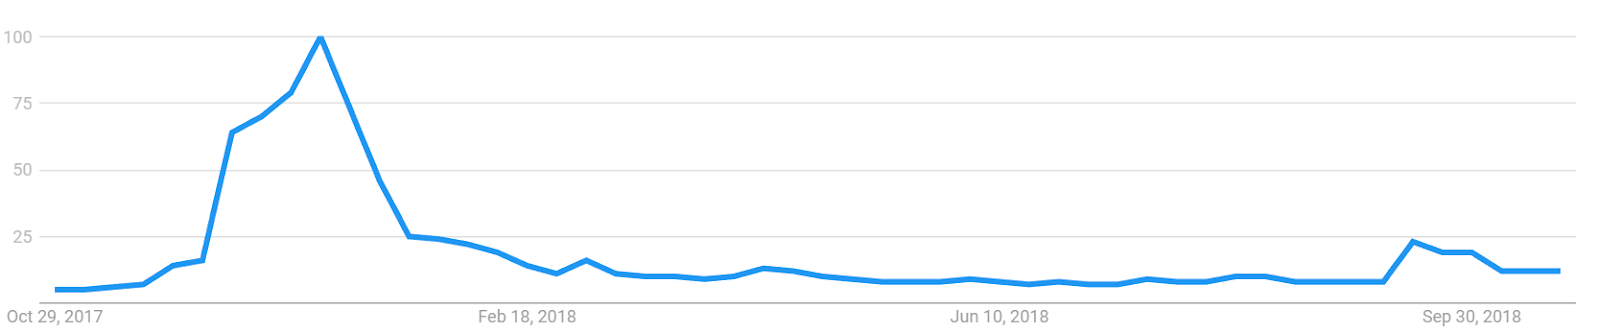
Google Trends for the term “XRP” remain down sharply over the course of the year with a small spike in September. A slow rise in searches for “XRP” preceded the bull run in Q4 2017, likely signaling a large swath of new market participants at that time. A 2015 study found a strong correlation between the google trends data and bitcoin price. A May 2017 study concluded that when the U.S. Google “bitcoin” searches increase dramatically, bitcoin price drops.
Technical Analysis
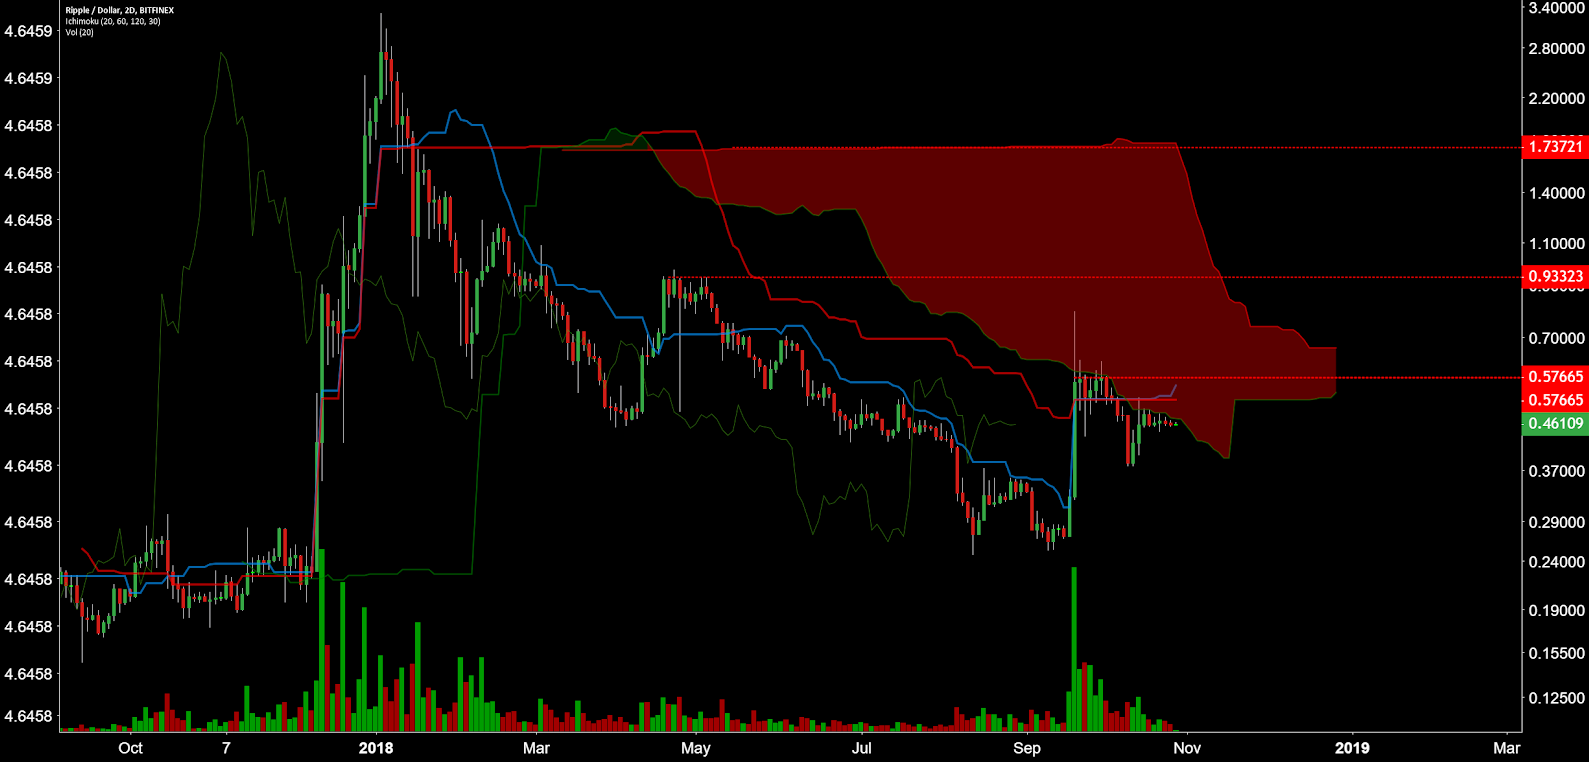
XRP has continued to drift downward after a strong few days in mid september, with a macro trend reversal looking more and more possible. To determine entries and exits, Ichimoku Cloud, exponential moving averages (EMAs), and volume profile can be used. Further background information on the technical analysis discussed below can be found here.
There are four key metrics when looking at the Ichimoku Cloud; the current price in relation to the Cloud, the color of the Cloud (red for bearish, green for bullish), the Tenkan (T) and Kijun (K) cross, and the Lagging Span. Trades are typically opened when most of the signals flip from bearish to bullish, or vice versa.
On the two day chart, the Cloud metrics lean bearish; price is below Cloud, Cloud is bearish, TK cross is bullish, and Lagging Span is above Cloud and below price. The long flat Kumo at US$1.74, which should act as a magnet for price, represents a 50% retracement target for the high and low of the range. Other key horizontal resistance includes US$0.57 and US$0.93, both of which will be pitstops for price when a frank bull trend returns.
Price will soon breach the Cloud and trigger an Edge to Edge long trade as well. These trades are considered trend reversal trades and trigger when price closes within the Cloud. The target for these trades is always the opposite edge of the Cloud, ~US$0.70 in this case. The stop loss for these trades triggers when price falls below the Kijun and/or Cloud.
On the daily chart, Cloud metrics also lean bearish; price is below Cloud, Cloud recently flipped bearish, TK cross is bearish, and Lagging Span is inside Cloud and below price. A traditional long triggers when price returns above Cloud. Price failed to close above the Cloud with a bullish TK cross despite the strong move up in September. Once the daily Kumo breakout does occur, bids should be placed at or near the Kijun to catch any bullish support tests.
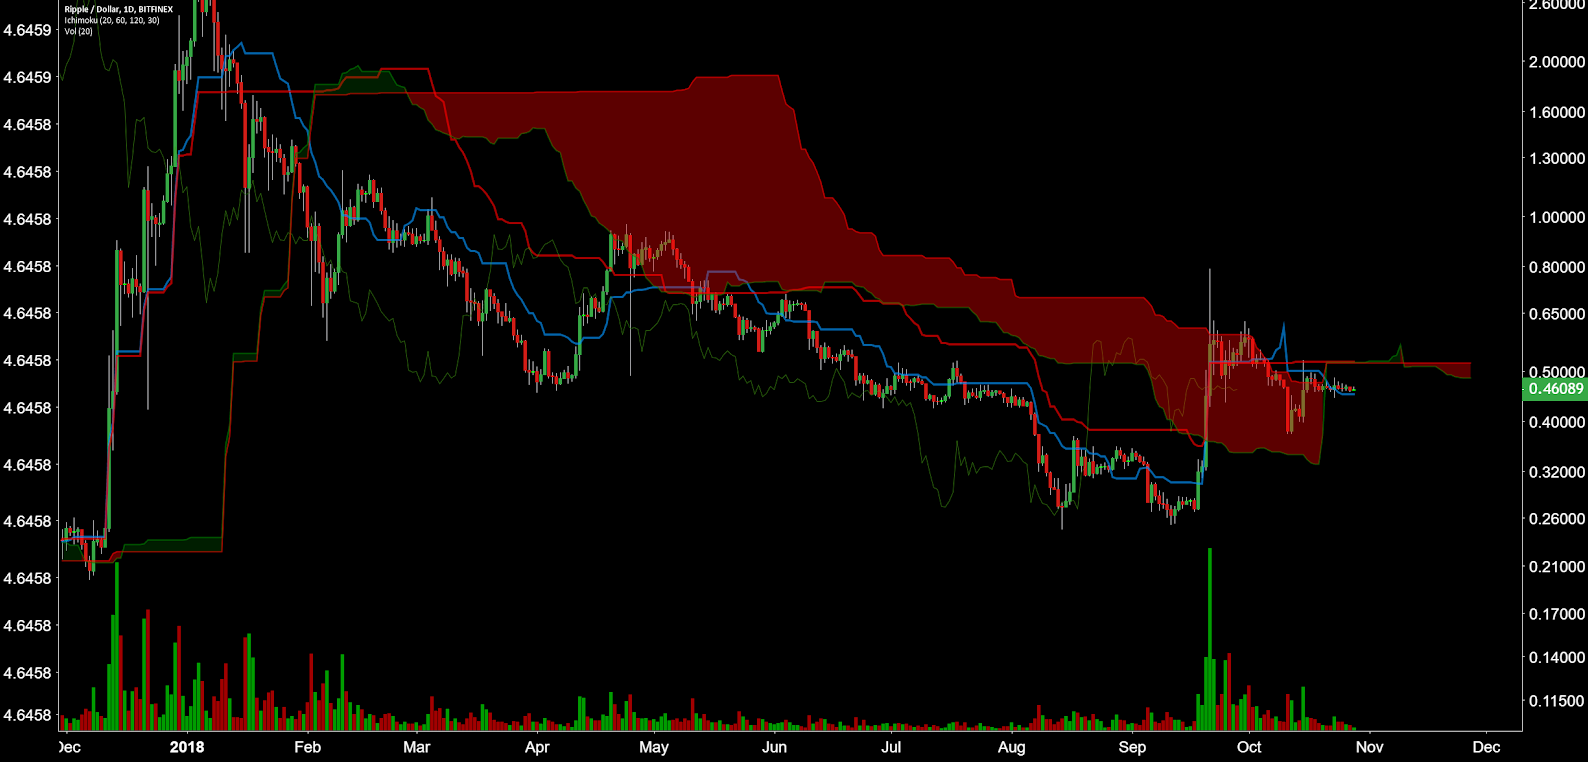
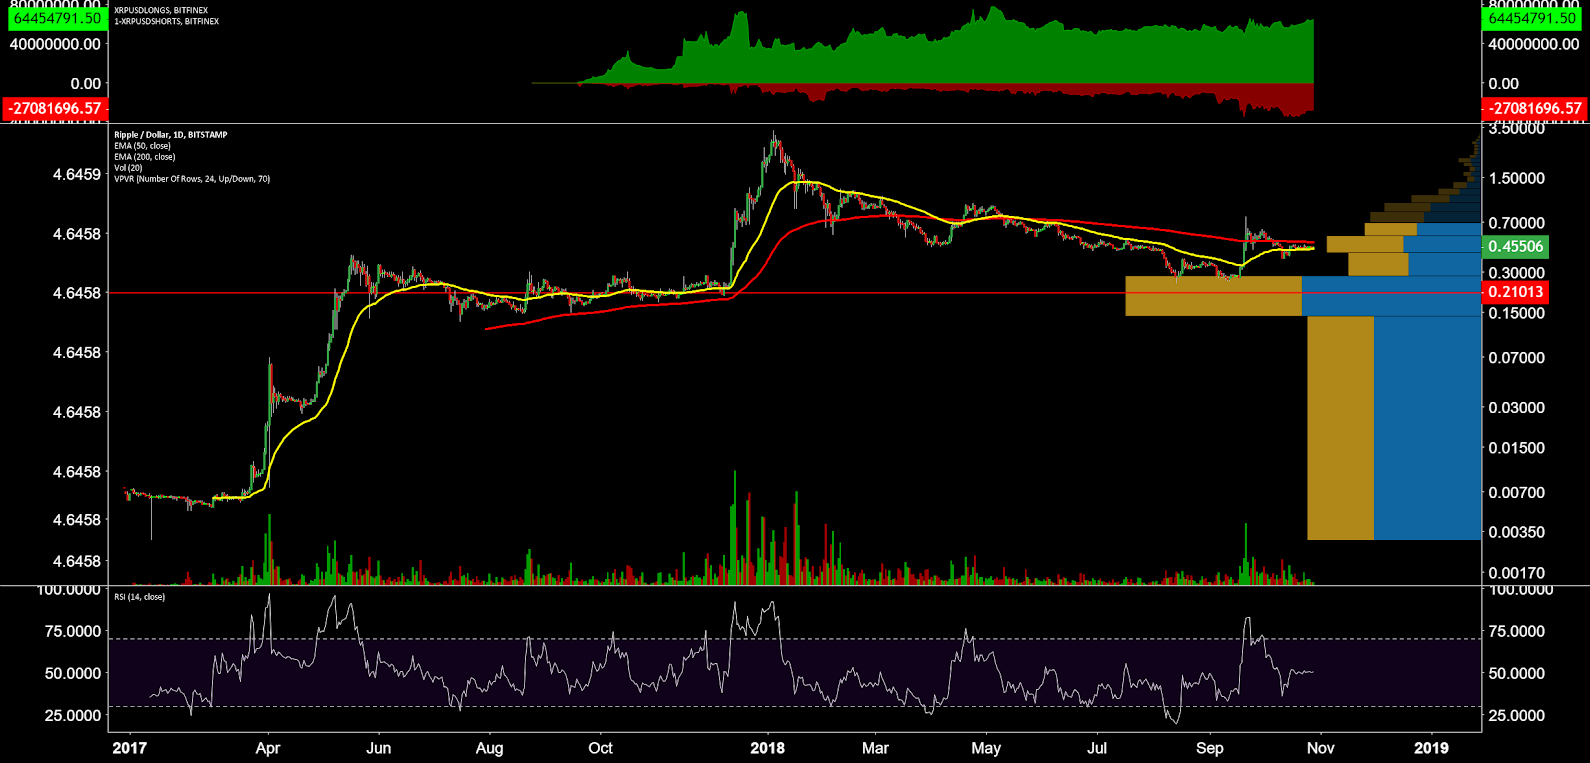
The 50/200EMA on the daily chart has continued to hold a bearish cross since May 21st. Price is currently holding above the 50EMA. A bullish Golden Cross in the coming weeks would suggest further upside. There are no active bearish RSI divergences on the daily timeframe.
The volume profile from 2017 to date shows that most of the volume has occurred in the US$0.14-US$0.27 range. The volume profile also shows relatively little volume above US$0.54. Long/short open interest on Bitfinex is currently heavily net long with a 70/30 split. Longs are near record highs, suggesting that a substantial price move downward will be exaggerated by margin positions closing.
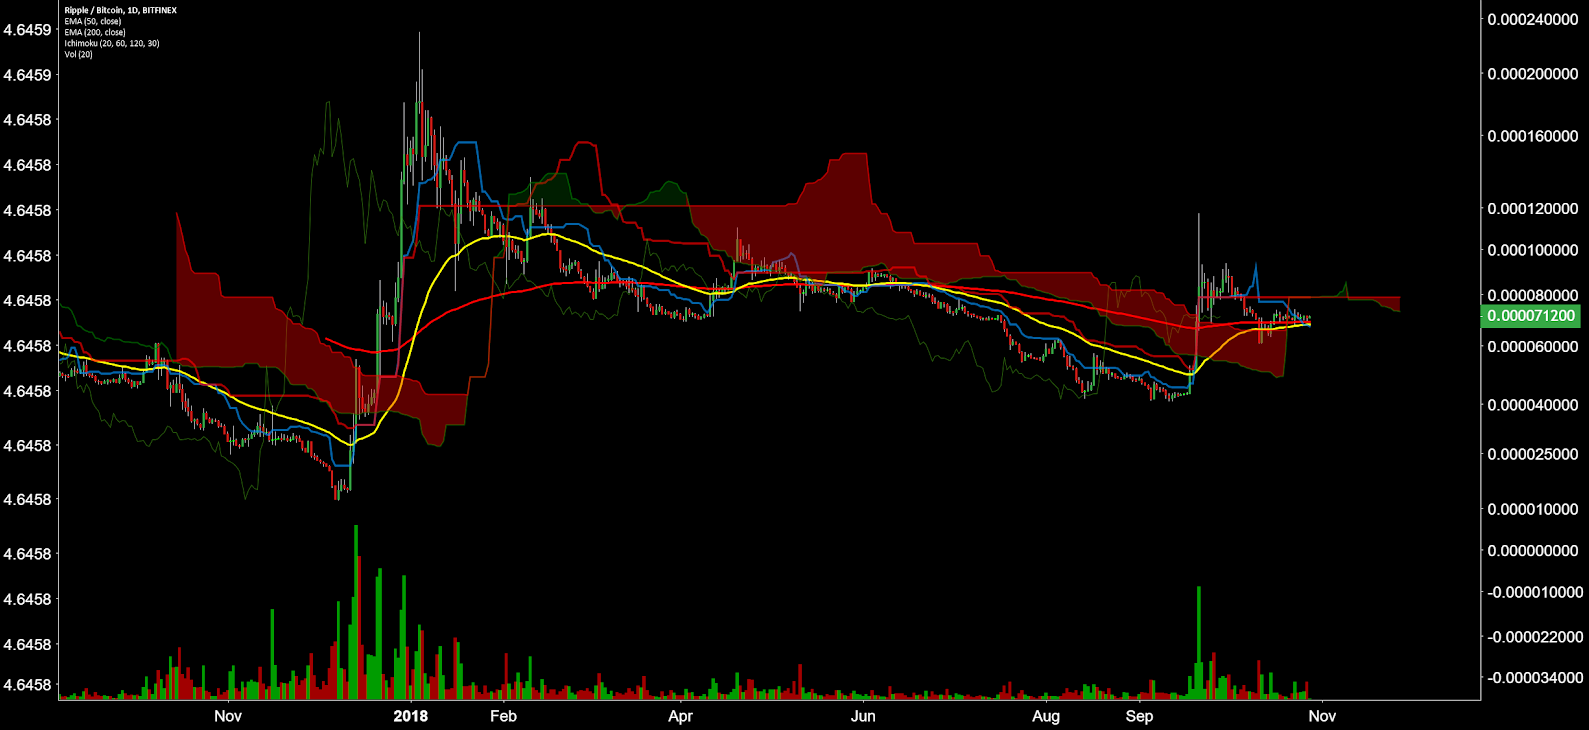
Lastly, for the XRP/BTC pair, price is above both the 50EMA and 200EMA but all Cloud metrics remain bearish. A bullish 50/200EMA cross with a candle close above the Cloud should prove to be an ideal long entry. Volume has declined significantly since mid-december but a spike in volume, bullish or bearish, should determine the trend over the next few months. If the bull trend materializes, a retest of the local high at 120,000sats is likely.
Conclusion
Network metrics, including transactions per day and NVT, show that increased banking partnerships with RippleNet have not converted into more network traffic. xRapid is the only part of RippleNet that uses the XRP token, went live at the beginning of the month, and will likely need time to develop further. Even so, xRapid’s buying and immediate selling of the XRP token is not a net gain for demand in and of itself.
The gorilla in the room continues to be whether or not XRP represents an unregistered security. Ripple has created, escrowed, owns a majority of, and continues to control the flow of XRP tokens. Ripple argues that the network is decentralized because the XRP token does not represent shares of Ripple, the company, and the XRP network would continue to exist if Ripple did not. Several pending court cases, as well as clarity from the U.S. Securities and Exchange Commission, would clear any regulatory uncertainty surrounding the asset.
Technicals lean bearish with a strong possibility of trend reversal before year’s end. Any further upside above US$0.55 would be the first time that price has been above both the daily Cloud and the daily 200EMA since January, both of which represent a litmus tests for bullish or bearish price sentiment. Longer term targets of US$0.93 and US$1.73 are also possible with a persistent bull trend.
Read more at: Brave New Coin


