


Bitcoin (BTC) has entered a consolidation phase. The price has been trading in very narrow range for the past few weeks. However, this is not happening for the first time. As explained in our previous analyses, we believe that Bitcoin (BTC) completed one full cycle between 2014 and 2018. The next cycle is expected to last half the duration of the previous cycle i.e. a total of two years from 2018 to 2020. Some might readily agree with this considering BTC/USD just completed its recent correction in half the duration of its previous correction. However, others may disagree with this view which is why we will highlight the similarities between 2014 and 2018 with the help of fractal analysis.
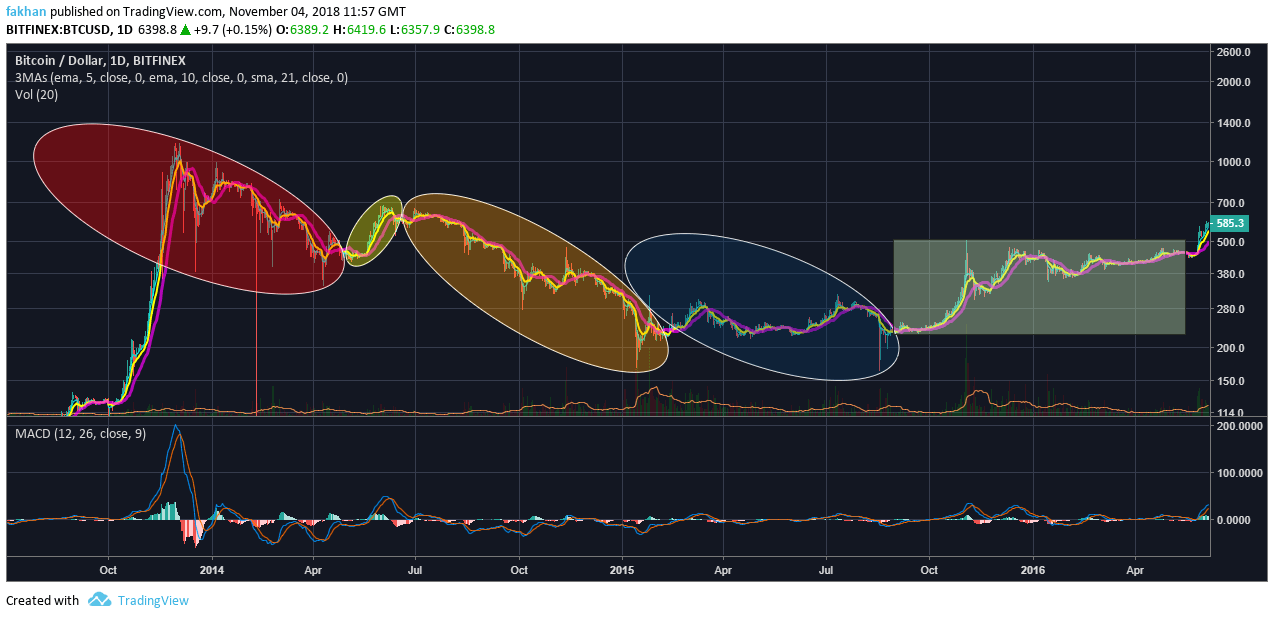
The above daily chart for BTC/USD shows the correction during 2014. We have divided it into five segments. The first segment shows an aggressive fall from Bitcoin (BTC)’s all time high. The second segment shows a ray of hope where some investors think that the correction is over. The third segment shows continued correction. The fourth segment shows the possibility of a reversal. The fifth segment shows preparation for a trend reversal. All of these segments are part of a full correction cycle for Bitcoin (BTC). As the chart shows, Bitcoin (BTC) starts to rally around mid 2016 and later reaches its all time high near $20,000.
A full Bitcoin (BTC) cycle comprises of three parts, the correction, the gradual ascend and the aggressive bull run. During 2014, Bitcoin (BTC) took almost two years to complete the correction part of the cycle and then the next two years to complete the gradual ascend and the aggressive bull run. The last part of the cycle, the aggressive bull run was completed in a very short period. If the same follows during the ongoing cycle (duration of 2 years), we will see Bitcoin (BTC) correcting during half the duration of the entire cycle. Considering that we believe the next cycle will last from 2018 to 2020 that means the correction will last approximately till the end of 2018. The next one year, i.e. all of 2019 will thus see the next two parts of the cycle i.e. the gradual ascend and the aggressive rally being completed.
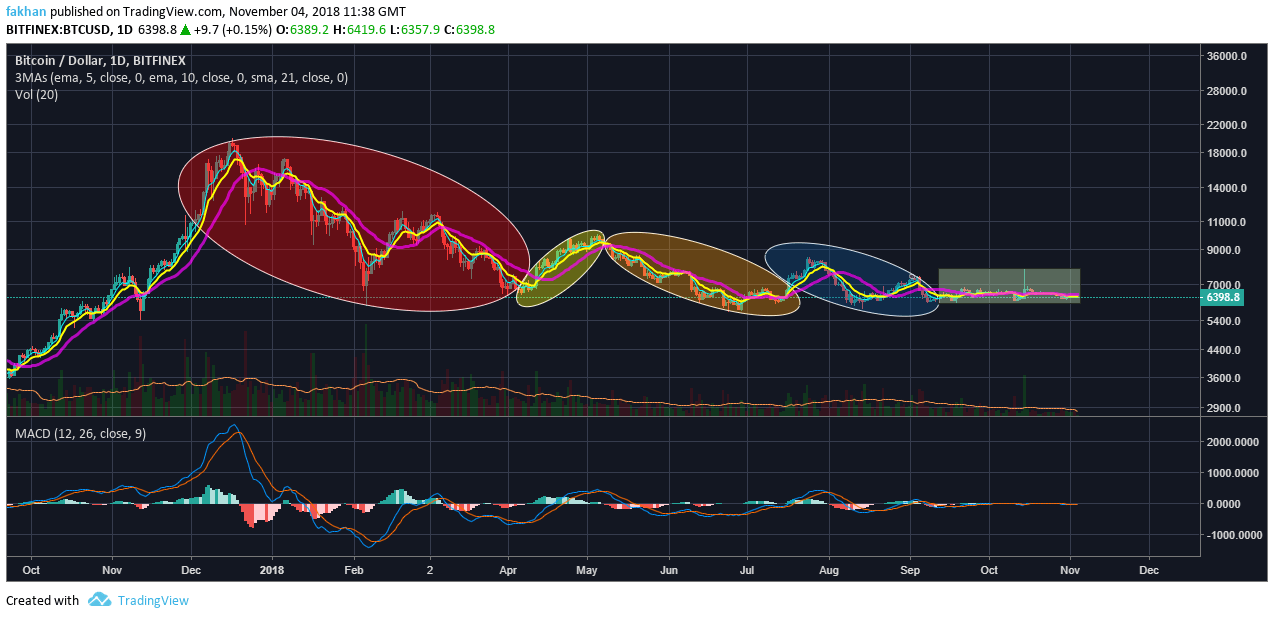
If we compare this BTC/USD chart to the one from 2014, we can see clearly how history always repeats itself. We are currently in the consolidation stage shown by the rectangle. If we compare fractals from 2014 and 2018, it is not hard to see what is going to follow next. A lot of people seem to think that we may still experience a correction like the one in 2014. However, they do not realize that we have already been through that correction. Towards the end of the year, Bitcoin (BTC) will prepare for the gradual ascend which is expected to last all the way till August 2019. After that, we will see the aggressive rally which would take Bitcoin (BTC) to its all time high around the end of 2019.
