


This article features 5 must-see commodities charts for 2019. We are not trying to make a forecast here, but indicate the hottest commodities charts that must be monitored closely as they might (will) bring fireworks going into 2019. Note though that these commodities chart, and how they resolve in 2019, may have a significant impact on our commodities forecasts, first and foremost our gold forecast 2019 and silver forecast 2019.
It goes without saying that the commodities market is crucial. Not only because it has strong potential gains (the downside of it is that there is lots of downside because of the high level of volatility) but also because it has an important meaning in global markets. If commodities do well it implies that there is ‘risk on’ as well as a decent level of inflation.
As per Wikipedia the number of traded commodities is significant, likely larger than you may think. Still, it is a handful of commodities that are really leading indicators, and worth following closely. Those leading commodities are able to move markets.
Must-See Commodities Charts For 2019: Inflation
First and foremost, as per our inflation forecast for 2019 there is a possibility that inflation has started a new cycle. If that is the case we will see a rising level of inflation, mildly or wildly, in the next few years.
How do we derive this conclusion? The leading inflation indicator from Martin Pring over at StockCharts.com.
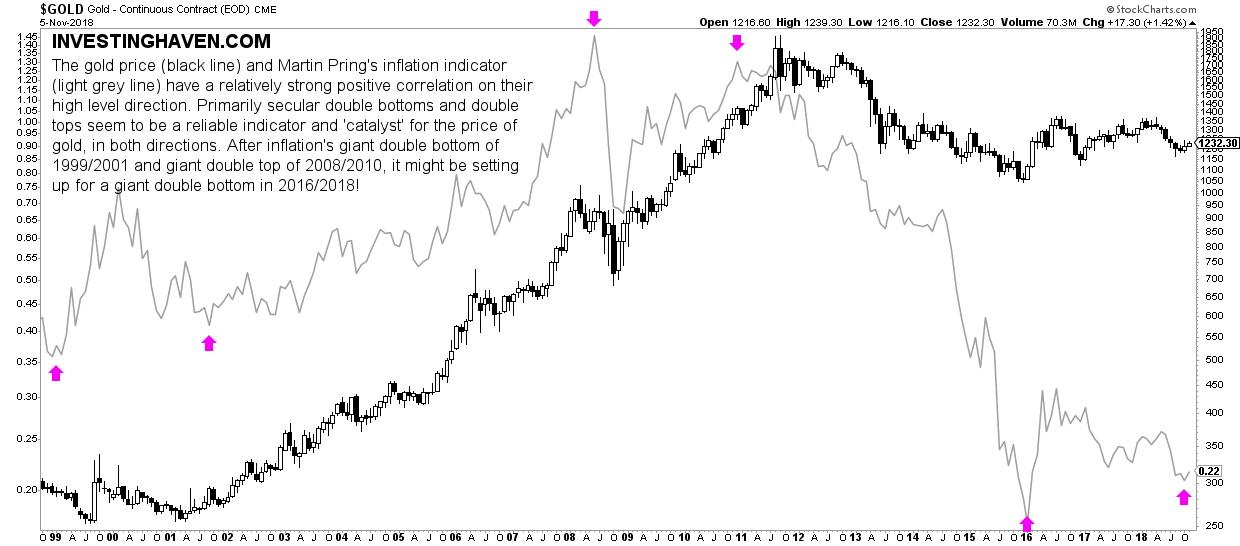
Below we look at the gold price overlaid by Martin Pring’s inflation indicator. This is the key finding from this chart:
The gold price (black line) and the inflation indicator (light grey line) have a relatively strong positive correlation on their high level direction. Primarily secular double bottoms and double tops seem to be a reliable indicator and ‘catalyst’ for precious metals prices, in both directions. After inflation’s giant double bottom of 1999/2001 and giant double top of 2008/2010, it might be setting up for a giant double bottom in 2016/2018!
It is this last sentence that is key: “After inflation’s giant double bottom of 1999/2001 and giant double top of 2008/2010, it might be setting up for a giant double bottom in 2016/2018.”
The chart indicates the major double bottom in 1999/2001 (with a higher low) and the major double top in 2008/2010 (with a major lower high). In a somehow similar fashion the 2016 major bottom may be a higher low against the 2018 bottom.
In other words, this chart suggests that (1) the high level direction of inflation and gold are correlated (2) inflation and the price of gold both suggest they will trend higher in 2019.
Must-See Commodities Charts For 2019: Crude Oil
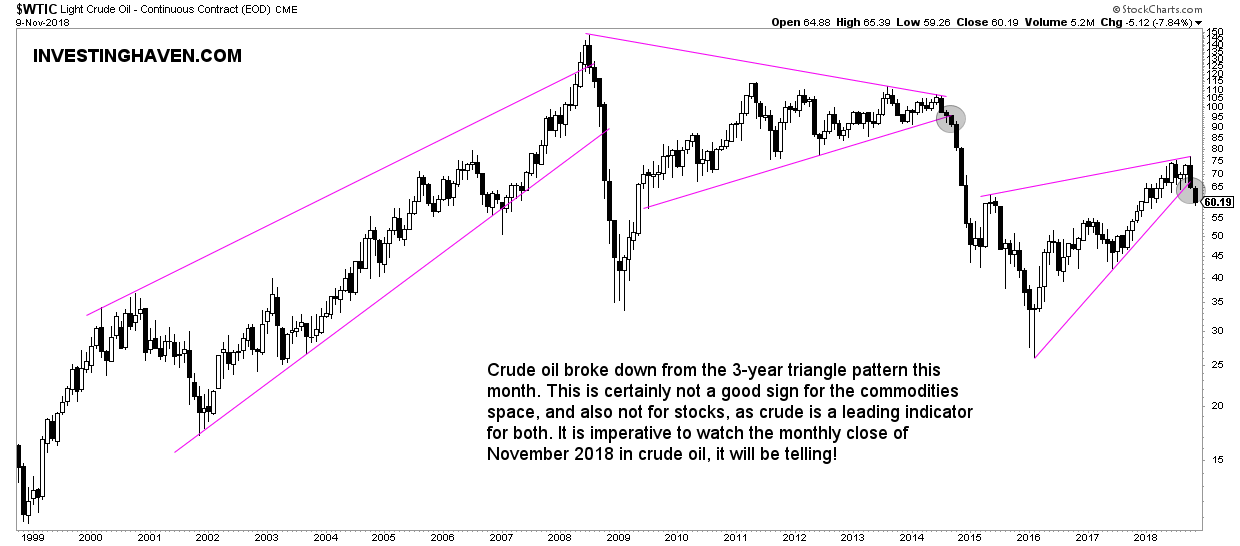
However, at the same time as we might get inflationary signals from the above chart, we see a breakdown happening in crude oil. This of course might have major implications in 2019.
As seen on the second chart crude oil is breaking down from its 3-year triangle.
The longer a chart pattern builds up the higher the impact. In other words the breakdown from the triangle in 2014 had a catastrophic effect because it was a pattern that was in the making for 6 years.
The current 3-year pattern is important but the effect likely not as devastating as the one in 2014. Again, the word ‘likely’ is important in the previous sentence.
This chart bears watching, and the monthly close in November and December will be telling, also about inflation.
Must-See Commodities Charts For 2019: Agriculture
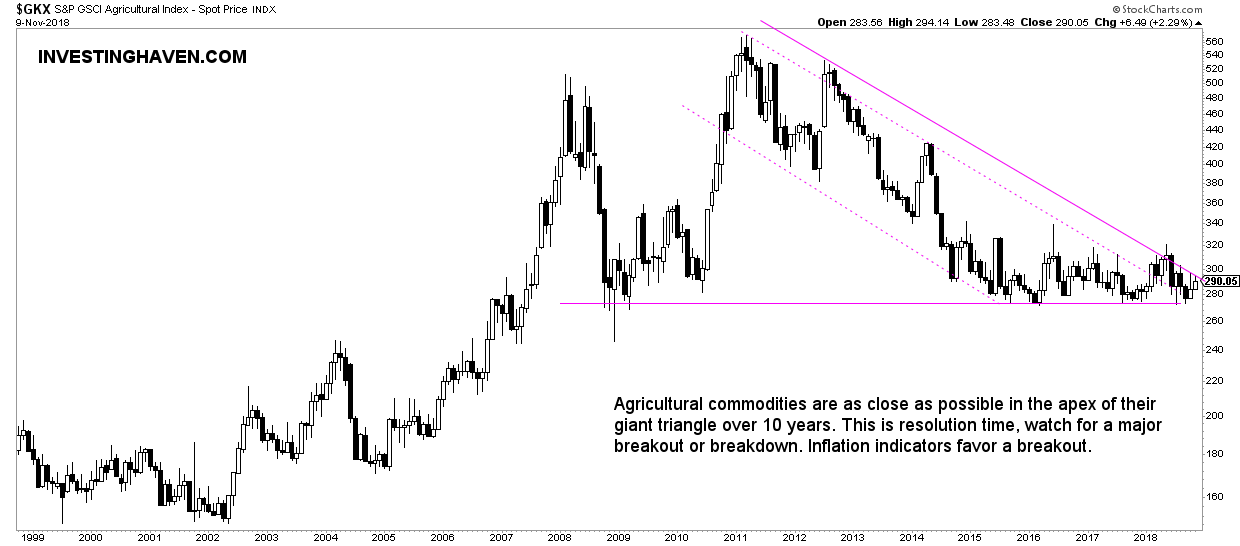
Agriculture has a chart setup that is closer to resolution. It is a matter of months, maybe even weeks, until this pattern resolves.
This giant triangle pattern in the making for 10 years now. In whatever direction this chart resolves it will be huge.
Based on the inflation chart above we would think an upside breakout is in the making.
However, the crude oil chart may bring the inflation indicator back down, resulting in either a continuation of the consolidation of coffee or, worst case, a break below this triangle pattern.
Anyways, in 2019 will see, for sure, a resolution in agriculture.
Must-See Commodities Charts For 2019: Coffee
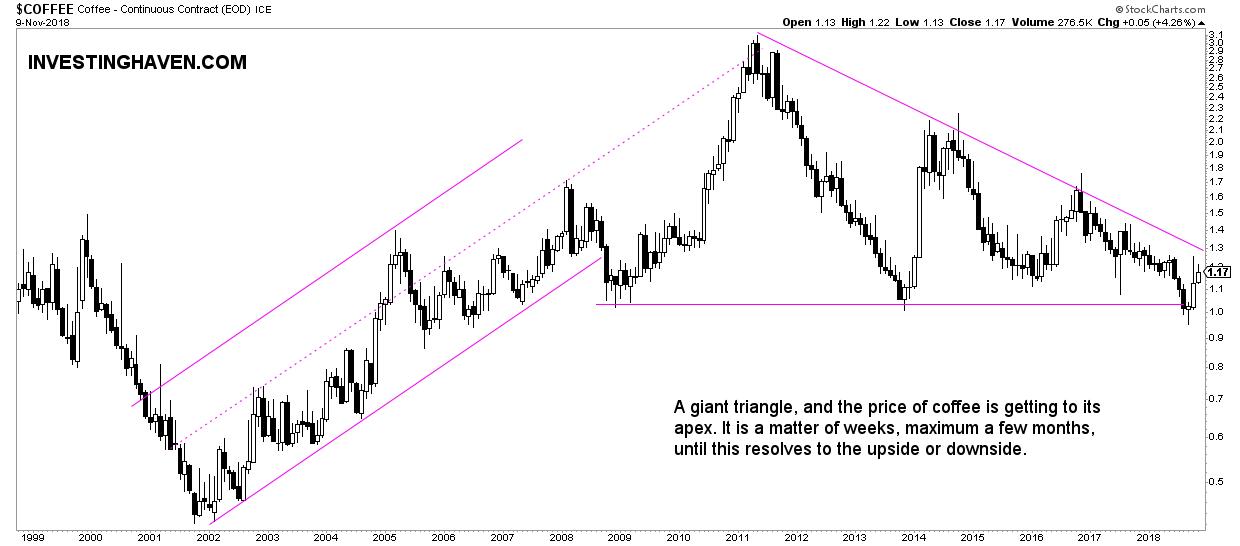
Coffee is one of the agricultural indexes included in the components of the chart (index) above.
We selected the coffee chart because of its amazing pattern.
The same comments as in the agriculture section above apply.
We will see a resolution of coffee in 2019.
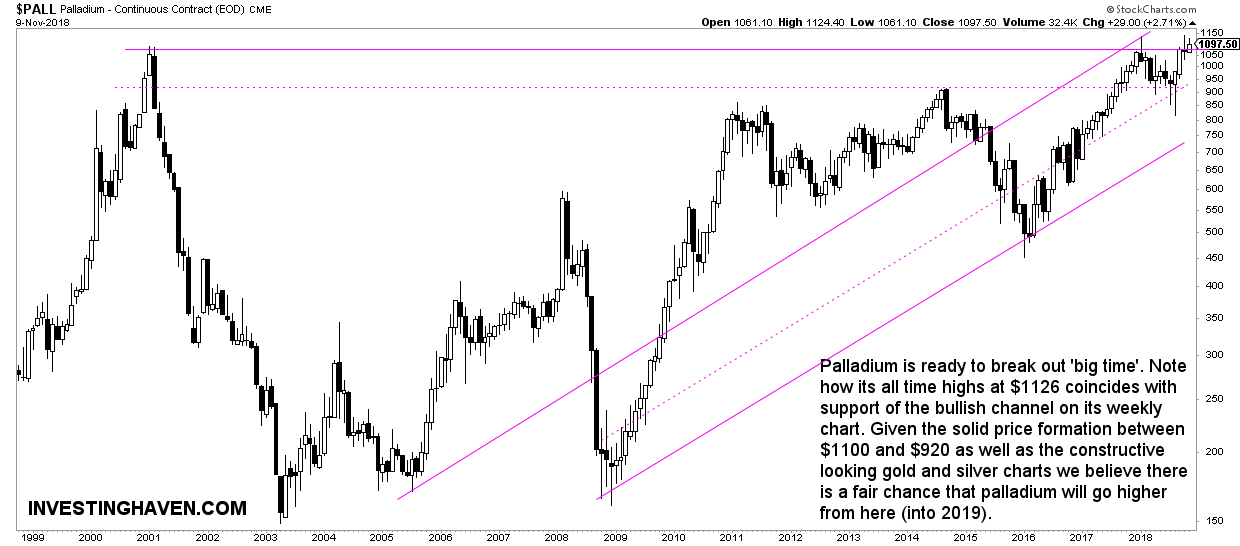
Must-See Commodities Charts For 2019: Palladium
Last but not least, the chart of palladium to close this article.
As per our palladium forecast for 2019 we see a couple of trends in the palladium market which may manifest in 2019.
First, there is a supply deficit which is building up for 5 years. We noticed a massive physical palladium exodus from ETFs which is reaching its limits. In a gold friendly environment, we see several primary and secondary indicators suggesting at much higher palladium prices to come in 2019. This of course gold to respect is recent lows, and trade higher in 2019.
InvestingHaven’s research team is on record with a palladium price forecast for 2019 of $1375 which likely will be a medium to long term top. It certainly is a profit taking price level if and once it gets there. Our thesis is invalidated if the $1125 does not get broken to the upside, or if a breakout appears to fail.
The monthly chart below shows a break-out is in the making. It is one of the must-see commodities charts for 2019.
TOP CRYPTOCURRENCIES TO BUY: InvestingHaven’s top crypto tips are in a “buy zone”. Top notch guidance on how to play the grand bull market in crypto from InvestingHaven’s research team, only for $2 per week. Crypto & Blockchain investing service >>
