


In our gold forecast 2019 we explained that the futures positioning is one of the leading indicators that suggests a major bottom is here. Similarly, in our silver forecast 2019 we said silver will follow gold’s way higher, so gold is the absolute leading indicator for the price of silver. Right now, we see one of our gold leading indicators suggesting exhaustion which implies a major bottom is being set around current levels.
The futures position is one of the 3 leading indicators, certainly an important one though not the only one.
First, a reminder, what is this gold futures position exactly?
Gold futures are shown in the Commitment of Traders Report, short COT, on a weekly basis. It shows positions in the futures market of groups of traders, first and foremost commercial traders and non-commercials traders. We see a pattern in this report: every time the net positions reach an extreme high or low it tends to coincide with price reversals on gold’s price chart.
Although the COT is not a timing indicator it has a track record suggesting gold price turning points on the short to medium term timeframe.
Based on the COT report we see that the downside in the gold price is extremely limited. How can we know? Look at the positions of the largest market participants (middle pane). The number of long contracts of non-commercials is at the lowest point in 3 years (red bars). This is not only historically low, it is even exceptional. It suggests that the downside in the gold price is extremely limited.
The gold price seems to stabilize around current levels, and that’s no coincidence. The gold COT report suggests the price decline has run its course, in other words traders are not able to push the price much lower because of their extreme net positions.
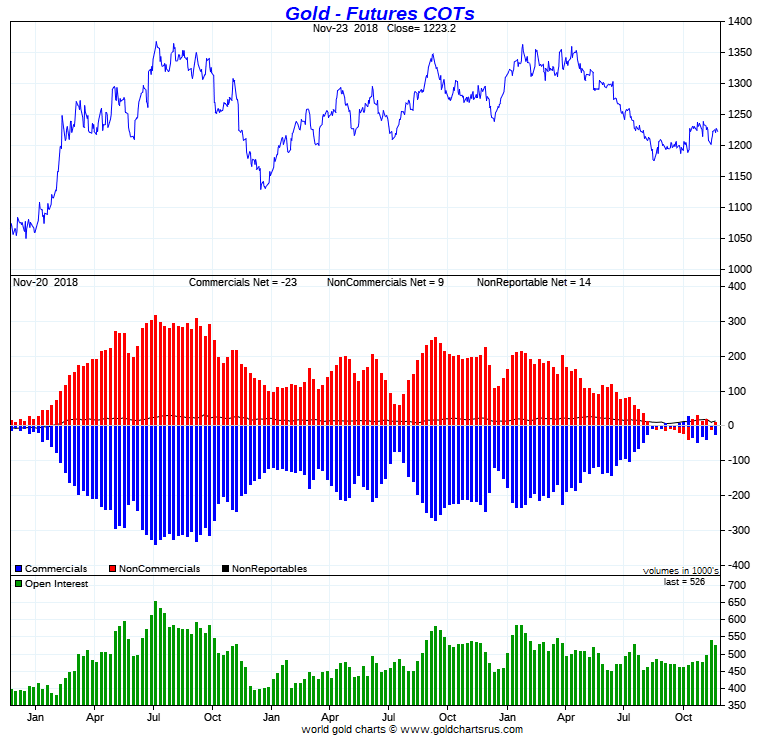
How does this relate to the other 2 leading gold price indicators, rates and the Euro? Simple, as long as both rates and the Euro will not move strongly lower we can expect the COT indicator to push the gold price higher anytime soon.
Again, it is not about timing, it is about price levels.
With this, our gold price forecast remains intact. As part of our gold price forecast for 2019 we believe that gold is setting a major cup-and-handle on its chart. The recent breakdown marked the start of the handle. We believe that gold, in this formation, will go back up in 2019 to test the $1300 to $1375 area. As that will be the 3d attempt for gold to break out of its strong resistance there is a fair chance gold will succeed.
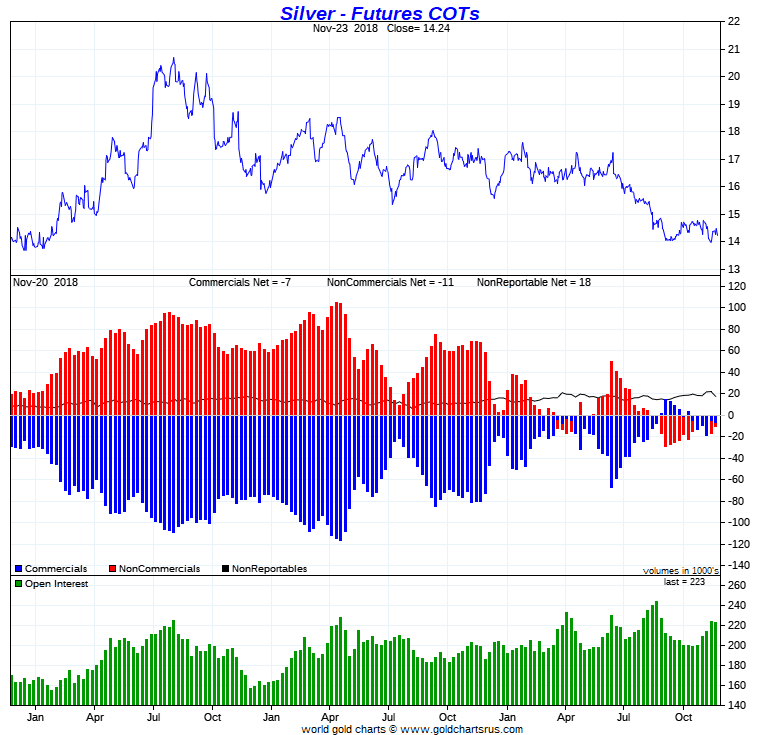
This has serious implications on the silver price as well. As seen below, on the silver COT chart, silver did already reach extreme positions a while ago. But gold was not that far yet. Now that gold is in a similar position when it comes to its gold COT chart we believe we have a confirmation of a major bottom for the short to medium term, possibly the long term even.
As long as the Euro respects support at 110 points we expect the gold price, as well as the price of silver, to start moving higher starting the next few weeks, ultimately in 1 to 2 months.
TOP CRYPTOCURRENCIES TO BUY: Which top crypto tips are flashing a BUY signal now? Which to avoid? Top notch guidance on how to play the grand bull market in crypto from InvestingHaven’s research team, only for $2 per week. Crypto & Blockchain investing service >>
